
Biofuels are often marketed as homegrown low-carbon fuels, but that’s not an accurate description of where the industry is headed. Between 2022 and 2024 bio-based diesel (BBD) consumption soared, but more than 70 percent of the growth came from imported fuels or fuels made with imported vegetable oils and animal fats (called feedstocks). That was mathematically inevitable, because the quantity of BBD the US consumed in 2024 was made from a larger quantity of vegetable oil and animal fat than the US produced that year. And of course, there are other uses for vegetable oils and fats beyond biofuels, including food and products like soaps and detergents.
Congress and the Trump administration are trying to address rising imports with preferences for North American fuels and feedstocks in tax policy and penalties for imports in the Environmental Protection Agency’s (EPA) proposed standards for 2026 and 2027 under the Renewable Fuel Standard (RFS). But the fatal flaw in the RFS proposal is that it ignores any realistic assessment of how much domestic feedstock is available for fuel production, proposing volumes that far exceed domestic feedstock availability. These mandates can only be met with a combination of imports and counterproductive shuffling of vegetable oil out of food markets and into fuel markets, where it will be backfilled with increased imports in these markets. This will raise fuel prices for drivers, increase the deficit, raise food prices, increase global hunger and accelerate deforestation.
If the US government wants to support a homegrown biofuel industry it needs to be realistic about the available homegrown resources and scale its policies accordingly. The US no longer has any surplus vegetable oil or animal fat, and further enlarging mandates for bio-based diesel fuels will increase US reliance on imports in the form of biofuels, inputs to biofuel production or imports of oils and fats to replace those diverted from food to fuel use.
Longer term, novel feedstocks like winter cover crops, perennial crops, or agricultural residues can support increased biofuel production while improving water quality and soil health in the US Midwest. Supporting the development of these underutilized resources would be a smart long-term strategy, with positive returns to US farmers and energy security. But that will take time, and in the meantime, EPA should be scaling back biofuel mandates based on a realistic assessment of domestic feedstock availability. With recently enacted changes to tax policy, domestic feedstocks already enjoy a substantial preference over imports, so scaling back mandates to match domestic feedstock availability would primarily reduce imports of feedstock and fuel while continuing to support production of fuels made from domestic feedstocks. This would save drivers and taxpayers money and reduce harm to the environment and food markets.
Bio-based diesel has outgrown domestic feedstocks
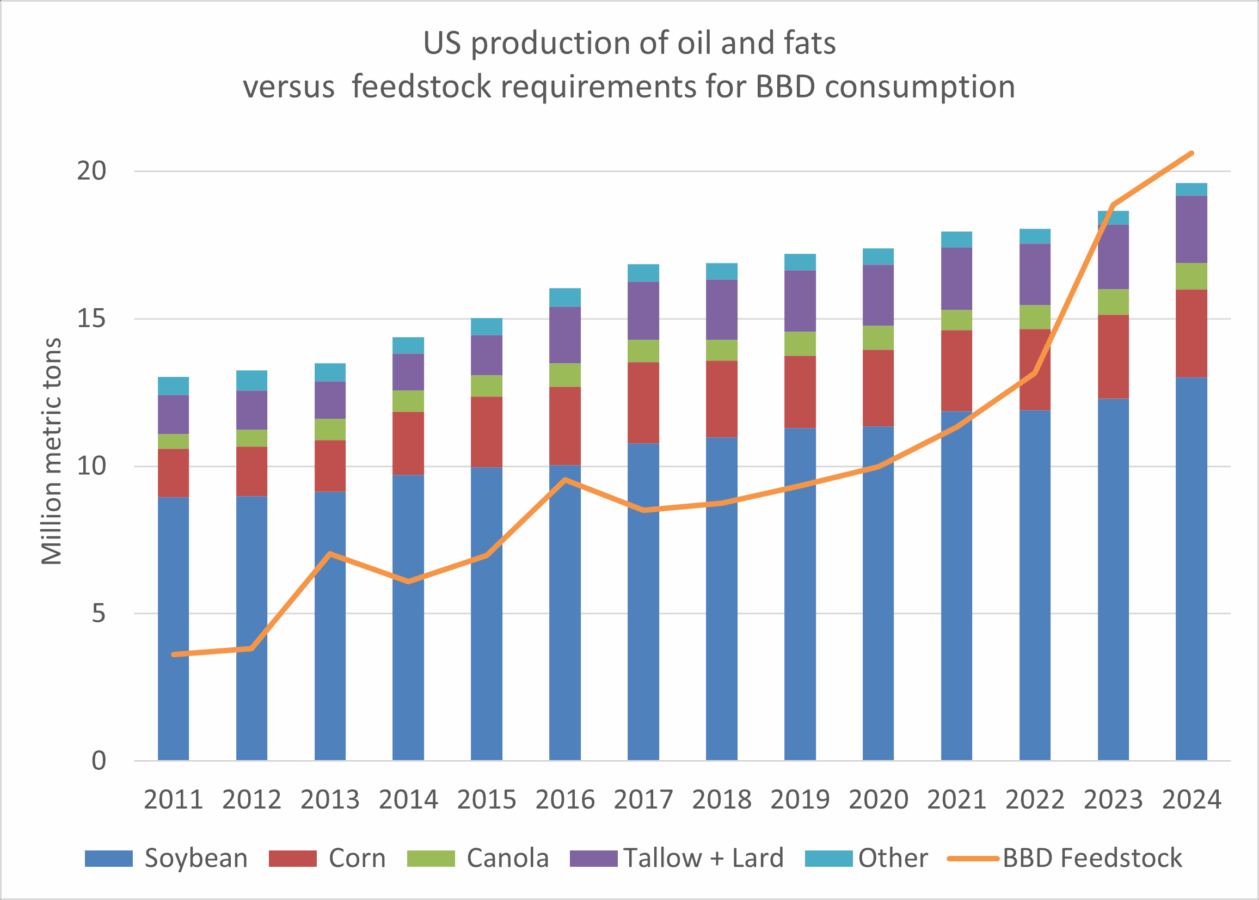
The rapid growth of bio-based diesel consumption has outpaced domestic feedstock production as shown in Figure 1 below. By 2024 the feedstock required to produce all the bio-based diesel produced or imported to the US exceeded total US production of oils and fats for all uses. With fuel production now consuming more fats and oils than total US production, the US is increasingly dependent on imports for vegetable oil for fuel, food and other uses. Increasing the domestic share of bio-based diesel feedstock by increasing imports in food markets does not in any meaningful way improve US energy security, and it is costly for consumers and harmful to the environment and food markets in the US and around the world.
Where does the feedstock come from?
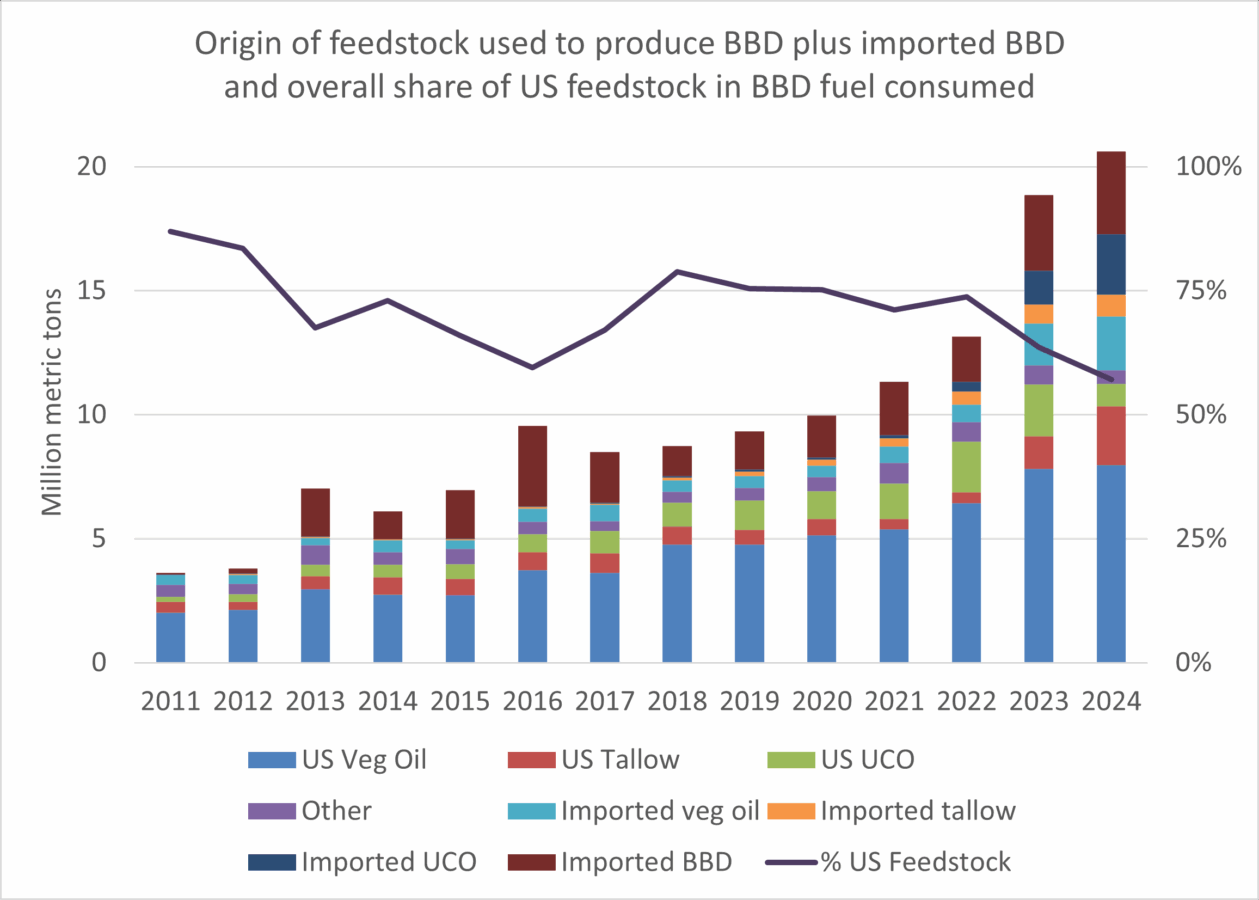
While Figure 1 compares total US production of vegetable oils and fats to feedstock requirements of US BBD consumption, Figure 2 looks specifically at the feedstock used to produce BBD and what share of these feedstocks were imported. It shows that the surge in BBD consumption between 2022 and 2024 relied heavily on imported feedstocks and fuels, which is not surprising given that BBD consumption is growing so much faster than domestic feedstock production.
The US has become a major vegetable oil importer
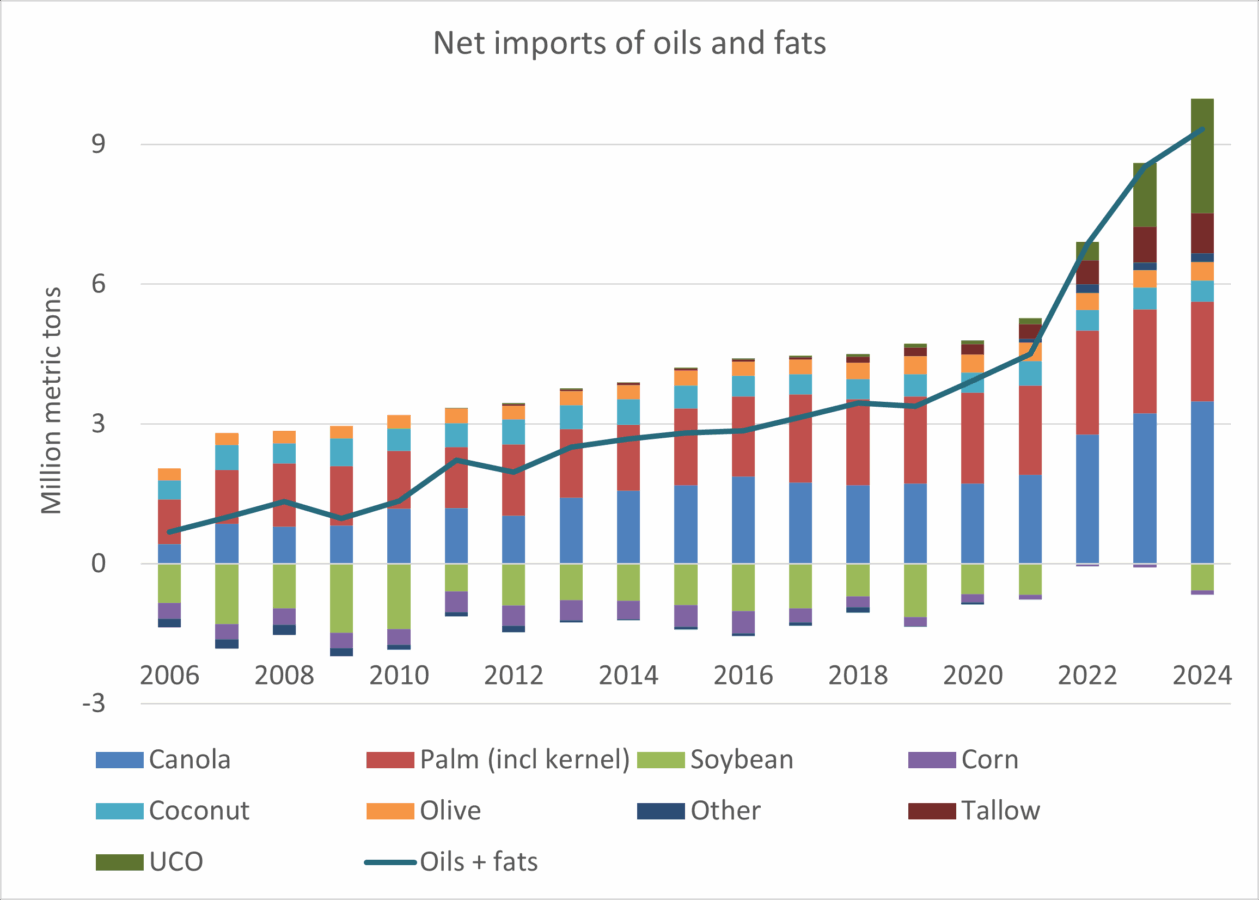
While the US is importing 5.5 Million Metric Tons (MMT) of BBD feedstock and another 3.3 MMT of feedstock in the form of finished fuel, this understates the overall impact, because the US is also importing steadily more of the vegetable oil it uses for food. Figure 3 shows total US trade balance in all oils and fats, for food, fuel and other uses. Before the biofuel era, the US had almost balanced trade in vegetable oil, with net imports of less than 1 MMT in 2011. Imports have grown steadily and took off in the last few years with net imports now exceeding 9 MMT. The US generally has a large agricultural surplus, exporting more agricultural commodities than it imports, but for vegetable oil the US is now the 4th largest importer of vegetable oil in the world, behind only India, China and the European Union.
Wonk Alert: jump to the conclusion for the TL;DR
The discussion below gets almost four thousand words deep into the details of the EPA’s Proposed Renewable Fuel Standards for 2026 and 2027 and was submitted as my public comment. Click here to jump to the conclusion.
The RFS proposal exceeds domestic feedstock availability by 3 billion gallons
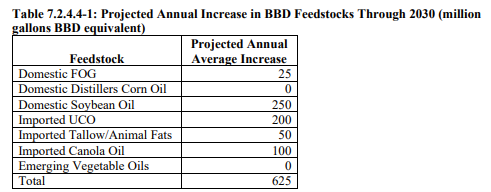
To evaluate the EPA proposal, I’ll switch back to billions of gallons of fuel. Converting the feedstock figures above to gallons, in 2024 the US consumed 5.6 billion gallons of bio-based diesel, but only 3.2 billion gallons, or about 57 percent, were made from domestic feedstocks. Looking forward, EPA’s analysis finds that domestic feedstock availability could support annual increases of 275 million gallons of bio-based diesel. On page 297 of the Draft Regulatory Impact Assessment (DRIA) EPA summarizes various projections of available soybean oil to BBD producers. USDA’s estimate is 50 million gallons a year, while the American Soybean Association suggests 350 million gallons a year. To put these numbers in context, trend yield growth of soybeans over the last 50 years is 0.51 bushels per acre per year, so yield growth from the approximately 85 million acres of soybeans harvested each year in the US would supply less than 60 million gallons of BBD[iii], even if all the yield growth was devoted to fuel production. Growth rates for soybean oil that exceed this figure cannot be met with yield growth, and imply diversion of soybeans from existing markets and expansion of acreage of soybeans at the expense of other crops or land uses. EPA does a similar analysis for fats oils and greases and canola oil and produces the following summary on page 304.
EPA’s decision to project a 250 million gallon annual increase in soybean oil is far above yield growth and much closer to that of industry studies than USDA’s projection of 50 millions gallons a year. But even with this optimistic estimate, EPA still projects only 275 million gallons per year of available domestic BBD feedstock, and the majority of available feedstock in this assessment (350 million gallons of BBD) is imported. Adding EPA’s assessment of domestic availability to production from domestic feedstocks in 2024 would support not more than 3.75 billion gallons of domestic BBD in 2026. Yet the proposed standard is about 3 billion gallons more than that. This is a recipe for substantial increases in imported feedstock and the diversion of domestic feedstock from food to fuel markets.
Discounting credits for imported feedstocks and fuels is unnecessary and counterproductive
EPA arbitrarily proposes to discount the compliance value for imported feedstocks and fuels by 50 percent, motivated by the desire to focus the RFS on domestic feedstock. The compliance credits under the RFS are referred to as RINs for Renewable ID Numbers, and they are the currency of the RFS. The EPA proposes that imported fuels or fuels made from imported feedstocks would generate just 50 percent as many RINs as fuels made from domestic feedstocks. This RIN discounting proposal came as a surprise, and it appears to have been developed late in the process of EPA’s analysis, as it is inconsistent with the framework adopted in bulk of EPAs analysis in the DRIA.
The goal of prioritizing domestic production is not itself unreasonable and is consistent with the statutory goals of the RFS. However, the proposed RIN discounting mechanism is a poorly designed tool for that job. Recently enacted changes to the 45Z biofuel tax credit ensure that North American feedstocks and fuels already enjoy a substantial preference, rendering the RIN discounting redundant. Moreover, as a mechanism to reduce imports the RIN discounting mechanism will backfire, since while RINs issued for imported fuels will be reduced, the overall size of the mandate will not be adjusted, so twice the volume of imports will be required to meet the portion of the RFS that cannot be met with domestic feedstocks and fuels. This approach also undermines market clarity by adding uncertainty into how much biofuel will ultimately be required to comply with the RFS.
One major impact of the RIN discounting will be to divert a lot of US vegetable oils from existing uses to use making fuel. The diversion of domestic feedstock from food to fuel uses is discussed in the DRIA in section 3.2. On page 95, EPA explains that the 50 percent reduction in RINs for imported feedstock “will incentivize BBD producers to pay higher prices for these domestic vegetable oils than their current markets. […] other markets will turn to imported canola oil and/or corn oil to satisfy their market demand, or alternatively will switch to other vegetable oils in greater supply or reduce their use of vegetable oils.” To put some numbers to this, if the price of a bio-based diesel RIN is $1.50, a pound of domestic soybean oil will be worth 15 cents more to a renewable diesel producer than imported soybean oil, but a producer of food or other products will not receive this premium for domestic feedstocks. Average annual prices for soybean oil have ranged from 28 to 73 cents per pound over the last decade, averaging 45 cents per pound, so a 15 cent per pound difference is 20-50 percent of the value of the oil. In a commodity market this seems likely to overwhelm other factors and lead to extensive diversion of soybean oil from food to fuel uses, with these non-fuel markets backfilled with imported oils. Notably, EPA names only canola and corn oil as potential import replacements, ignoring palm oil and soybean oil, which account for two thirds of global vegetable oil exports, and are closely linked to deforestation.
Who pays the price for larger mandates and who benefits?
The cost of policies supporting bio-based diesel is considerable. As Professor Irwin at farmdoc daily explains, bio-based diesel prices (not counting direct and indirect subsidies) tend to be about double those of fossil diesel, a difference of about $2 per gallon, which must be made up by policy. There are a number of different policies that determine how these costs are distributed to different parties. Generally, costs are borne by people buying gasoline and diesel and taxpayers that bear the cost of tax credits. US BBD consumption exceeded 5 billion gallons in 2024, meaning the total costs are above $10 billion a year, and as the volumes rise so do the costs[iv].
Most of that money is simply wasted, turning expensive vegetable oil into cheap diesel. Moreover, because vegetable oil production, biodiesel production and renewable diesel production are mature technologies, there is no realistic prospect that scaling up production will bring down costs. By design, the RFS was intended to support the development of innovative not-yet commercialized technologies that would produce low carbon cellulosic biofuels from inexpensive and underutilized agricultural residues or high yielding perennial grasses that build soil carbon and reduce erosion and water pollution. While the commercialization of cellulosic biofuels has moved much more slowly than was envisioned in 2007, when the RFS was last amended, scaling up the productive use of underutilized and sustainable feedstocks remains a worthwhile policy goal. However, ramping up mandates for mature commodities far beyond domestic availability is inconsistent with the statutory criteria EPA is required to consider in setting biofuel volumes under the RFS.
The largest share of the cost of BBD support is transferred to US fuel consumers through the RFS. Analysis by the EPA in the DRIA find that more than 90 percent of the cost of complying with the RFS, $6.7 billion a year, is associated with BBD. These costs are spread across all the gasoline and diesel fuel consumed in the United States, adding about 10 cents per gallon to the cost of diesel fuel and 4.5 cents per gallon to gasoline, according to EPA’s DRIA[v]
A portion of the cost is also born by taxpayers who subsidize biofuel production through tax credits. Increasing the size of the RFS increases the cost of these tax credits, adding to the deficit and debt. The unprecedented nature of the RFS proposal, the uncertainty in how much feedstock will be imported and how US and global agriculture markets will respond and the simultaneous changes in tax policy make it difficult to project with confidence the overall and distributional impact on costs for US drivers and taxpayers. My intuition is that EPA’s estimates are too low, but more thorough analysis is needed. Ultimately we won’t know the full cost until the policy is implemented.
Despite this uncertainty, it is clear the costs of the proposal far exceed the benefits. The only monetized economic benefits spelled out in the proposal are $163 million in energy security benefits, or 3 percent of the fuel costs. EPA does not include any estimate of environmental costs or benefits, but as discussed below it is clear based on EPA analysis that the increase in crop-based fuels driven by the proposal would increase deforestation and associated greenhouse gas emissions.
Insofar as anyone wins from this proposal, the primary beneficiaries are palm oil producers. Even though palm oil is not used directly to make biofuel in the US, EPA analysis and common sense make it clear that palm oil (as the largest source of vegetable oil production and exports in the world) and other foreign feedstocks will backfill food markets in the US and around the world that had previously been consuming soybean oil. Meat producers around the globe may also benefit from cheap soybean meal subsidized by US drivers and taxpayers. And oil companies (the petroleum variety) benefit in three ways: by producing heavily subsidized bio-based diesel; by reducing compliance costs of fuel regulations in states with Low Carbon Fuel Standards[vi]; and by misleading the public about the feasible low carbon alternatives to gasoline and diesel.
The proposal will lead to costly feedstock diversion without significantly expanding demand for soybeans and a limited and uncertain impact on soybean prices
Increasing the RFS mandate beyond domestic feedstock availability will provide a limited benefit to US farmers, because they can’t sell more soybeans than they produce. EPA does not project expanded production of soybeans. Two potential responses to increased demand for domestic feedstock are the diversion of domestic feedstocks from existing markets, and the diversion of whole soybeans from overseas crushing facilities to domestic crushing facilities. EPA’s projection that domestic soybean oil availability would grow by 250 million pounds, discussed above and in section 7.2.4.1 of the DRIA, already assumes rapid expansion of domestic crushing capacity, consistent with input from the soybean industry. Crush capacity expansion beyond this level is unlikely in the timeframe of the proposal since it takes several years to build additional crushing capacity.
But neither diverting US soybean oil from food to fuel nor diverting exported soybeans to domestic crushing facilities will increase overall demand for soybeans. The global market for soybeans is ultimately constrained by demand for soybean meal, which makes up 80 percent of each bushel of soybeans. The RFS proposal combined with the changes to tax policy will lead to shuffling of vegetable oil in US and global markets, as domestic soybean oil is redirected to fuel use to cash in on subsidies and mandates and other vegetable oils replace US soybean oil in unregulated food markets in the US and around the world. But at the end of the day, the high costs to consumers and taxpayers translate into small changes if any in demand for US soybeans.
The other question is whether this proposal will increase the price of US soybeans. It will almost certainly increase the price of domestic soybean oil, but the impact on price of the soybeans that farmers actually sell is more complicated. EPA’s analysis on this topic is based on a 2022 paper by Lusk prepared for the US Soybean Board on the impact of soybean oil BBD on food prices. This analysis explains that expanded biofuel production will cause a large increase in soybean oil prices, but a much smaller impact on soybean prices. Specifically, it projects that a 20% increase in soybean oil used for biofuel production will increase soybean oil prices by 8% but will only increase farm-level soybean prices by 0.9%. This is consistent with the recent USDA World Agricultural Supply and Demand Estimates released on July 11th, which accounts for the revised tax policy and the RFS proposal and projects large increases in the use of domestic soybean oil and in US soybean oil prices. Projected soybean oil prices increased 15 percent from $0.46 to $0.53 per pound. But increased soybean crushing puts downward pressure on soybean meal prices, which are projected to fall 6 percent from $310 to $290 per short ton. Prices projected for whole soybeans are almost unchanged, down 1.5 percent from $20.25 to $20.10 per bushel.
The point is that large increases in soybean oil prices will translate into much smaller increases in prices for whole soybeans. The RFS and tax policy changes are likely to disrupt global markets in significant and unprecedented ways and thus the impacts are hard to predict based on historical data, especially in a context where rapid changes in tariffs and trade patterns are already creating a turmoil in global agricultural markets. But the benefits for US farmers will be much smaller than the costs imposed on drivers and taxpayers, making this a very costly and inefficient way to support farmers.
What is the climate impact of expanding BBD?
While the EPA under administrator Zeldin has been clear in its disregard for the importance of climate stabilization, the RFS statute clearly identifies reducing global warming emissions as a central goal of the policy. EPA’s analysis for the DRIA reveals that the likely impact of dramatically expanding BBD consumption would be to increase global warming emissions. The two models evaluated, GCAM and GLOBIOM, differ in many ways, but both found large expansions of cropland would be required globally, with associated increases in emissions from land use change emissions[vii]. While both models nominally found that there are climate benefits of the proposal compared to a no-RFS baseline, this does not address the more salient question of how expanding the use of BBD beyond domestic availability will affect the climate, and whether the proposal is consistent with RFS statutory guidelines. However, we can infer the answers to these questions from the analysis EPA presents.
EPA’s analysis in the DRIA compares High and Low Volume Scenarios and the Proposed Volumes to a No RFS scenario (Tables 5.1.1-1 and 5.1.1-2). The only difference between the High and Low Volume Scenarios is in the use of BBD. The Low Volume Scenario evaluates an RFS that grows by 312 million gallons of renewable diesel each year from 2026 to 2028 and the High-Volume Scenario grows twice this fast. According to EPA’s analysis, the only fuels that will be affected by this growth are renewable diesel made from soybean and canola oil. By comparing the climate impact of the High and Low Volume scenarios we can determine the climate impact of increasing vegetable oil BBD consumption.
Both GCAM and GLOBIOM find that expanding consumption of BBD will lead to an increase of about 200 MMT of carbon dioxide equivalent emissions from land use change (including deforestation) and agriculture, but they differ in their net emissions once fossil fuel displacement is taken into consideration. The GCAM model finds a net emissions increase of 93 MMT CO2e, while EPA claims that GLOBIOM projects a net decrease of 87 MMT CO2e. However, the emissions reduction EPA attributes to GLOBIOM is not derived directly from that model, which does not include a detailed endogenous treatment of fuel markets and therefore can’t directly calculate emissions reductions from fossil fuel consumption. EPA makes an ad hoc assumption that the production of biofuels directly displaces petroleum fuels on a one-for-one basis, with no effect in other markets. This assumption ignores the well-known rebound effect, whereby reduced consumption of petroleum in the US lowers prices globally leading to increased petroleum consumption outside the US[viii]. This treatment is arbitrary and indefensible and means the GLOBIOM climate impact findings are clearly too optimistic.
Putting aside this problem with the GLOBIOM results, the climate benefits obtained from GLOBIOMs are still less than the RFS requirements for advanced biofuel. The GLOBIOM analysis finds that cumulative emissions associated with producing the additional BBD in the High Volume versus the Low Volume scenario are 66.3 g CO2e per MJ of additional BBD produced[ix]. This represents just a 27 percent emissions reduction versus 91 g CO2e/MJ for fossil diesel, which does not meet the statutory requirement that advanced biofuels reduce GHG emissions by 50 percent.
In summary, EPA’s analysis suggests that the climate impact of expanding RFS mandates beyond the level in the Low Volume Scenario is negative, or at best insufficient to justify the proposal. The GCAM model finds it will increase global warming pollution, while the GLOBIOM model, even biased by optimistic assumptions of fossil fuel displacement, finds a modest reduction of 27 percent compared to fossil diesel, which falls well short of the statutory requirement that advanced biofuels reduce emissions by 50 percent compared to fossil fuels they replace.
The RFS proposal will harm global food consumers and accelerate deforestation
In the long run, increases in consumption of vegetable oil that outstrip demand for protein meal will primarily benefit producers of vegetable oil that produce less protein meal, primarily palm oil. However, it will take time for palm oil production to replace the diverted soybean oil, because palm oil plantations take several years between a decision to expand and time to yield fruit. In the interim, global markets for vegetable oils will be tight, leading to higher prices. According to an analysis from the International Food Policy Research Institute (IFPRI), “Vegetable oils are a key item in diets around the world and an essential source of fats, accounting for about 10% of daily caloric food supply (300 kcal per day per person), making them the second most important food group after cereals.[…] Vegetable oils are, of course, an essential cooking item, particularly for poor consumers unable to shift to more expensive butter or other animal fat-based products.” The IFPRI report finds that each metric ton of vegetable oil converted into biodiesel globally represent an equivalent amount of calories to feed more than 10 million people per year. Thus, EPA’s proposal to set mandates 3 billion gallons beyond its own assessment of domestic availability will divert 11 million metric tons of vegetable oil from food to fuel markets which would otherwise provide calories to feed 100 million people per year.
Over time, palm oil production will expand to replace the displaced soybean oil and bring down prices. Palm oil is ineligible for the RFS because of its role in deforestation, but when it backfills diverted soybean oil, the harm may be one step removed from US biofuel production, but it happens just the same. The expansion of soybean and palm oil is a major driver of tropical deforestation. Recent analysis finds that annual forest carbon loss in the tropics doubled during the early twenty-first century[x] and that oil palm and soybeans are, respectively, the second and third largest drivers of deforestation after cattle[xi].
In conclusion
Back in 2016 I concluded a long blog on biodiesel with this warning:
To provide stable support for the biodiesel industry and to avoid unintended problems across the globe, it is important that policy support for biodiesel growth is consistent with the growth in the underlying sources of oils and fats. The EPA should scale back its proposal in light of these constraints.
While EPA’s decisions from 2016 to 2024 expanded the BBD market much faster than I recommended, EPA acknowledged the risks of excessive growth and set mandates below the extreme requests made by the biofuel industry. In comparison, the current proposal is extreme, proposing mandates completely untethered to any realistic assessment of feedstock availability. The expansion of imported feedstocks in the last few years has created political pressure to focus the biofuel support on domestic resources, which is understandable. But the EPA’s RFS proposal has no rational basis as a domestic fuel policy. Instead of massive growth, the RFS should be scaled back in line with domestic feedstock availability to support a domestic biofuels industry at a scale that makes sense given competing uses for food, crops and land and delivers a clear reduction in global warming pollution.
[i] Figure data is available for download at https://doi.org/10.7910/DVN/2OOVQB. Data on total production of vegetable oils and edible fats is from the ERS Oil Crops Yearbook plus technical tallow data from NASS Quick Stats. Data on feedstock consumption comes from Gerveni, M., T. Hubbs and S. Irwin. “FAME Biodiesel, Renewable Diesel, and Biomass-Based Diesel Feedstock Trends over 2011-2023.” farmdoc daily (14):71, Department of Agricultural and Consumer Economics, University of Illinois at Urbana-Champaign, April 12, 2024 and EIA Monthly Biofuels Capacity and Feedstocks Update.
[ii] In addition to the Oil Crops yearbook mentioned previously, this figure includes data on imported biodiesel and renewable diesel from EIA and trade data from the USDA Foreign Agricultural Service Global Agricultural Trade System.
[iii] Assuming 11 pounds of soybean oil per bushel and 8.125 pounds of soybean oil per gallon of BBD., even if all the yield growth was devoted to fuel production. Growth rates for soybean oil that exceed this figure cannot be met with yield growth, and imply diversion of soybeans from existing markets and expansion of acreage of soybeans at the expense of other crops or land uses. EPA does a similar analysis for fats oils and greases and canola oil and produces the following summary on page 304.
[iv] Note that $2 per gallon is the minimum price to make it possible to sell BBD and serves a floor for costs. To the extent that RD sales have higher margins than fossil diesel, or that tax credits result in higher returns than in comparable fossil supply chains, the actual costs to consumers and taxpayers are likely to be significantly higher.
[v] The EPA analysis of the price impacts on gasoline in is Table 10.5.2-7, diesel is in 10.5.3-7 and the total fuel cost impact is in Table 10.6-1, which also finds Energy Security Benefits of $163 million. EPA does not estimate the financial value of other benefits of the program.
[vi] Oil companies reduce their obligations under Low Carbon Fuel Standard policies by shifting RFS compliance into those states to maximize overlap in their obligations. For more details, see my January 2024 Blog, A Cap on Vegetable Oil-Based Fuels Will Stabilize and Strengthen California’s Low Carbon Fuel Standard.
[vii] The GCAM and GLOBIOM models used by EPA differ in model structure and assumptions and predict qualitatively different impacts. For example, GCAM predicts a larger increase in global soybean production, while GLOBIOM shows a more pronounced substitution of palm oil for soybean oil. Moreover, GLOBIOM lacks a detailed/endogenous treatment of the energy sector, meaning it does not capture the substantial rebound effect and thus exaggerates the impact of US biofuel expansion by ignoring rebounds in both global biofuel and oil markets.
[viii] This treatment is inconsistent with the consequential lifecycle analysis used elsewhere in EPA’s land use change assessment and renders the results unreliable. The National Academy of Sciences’ panel on “Current Methods for Life-Cycle Analyses of Low-Carbon Transportation Fuels”, on which I served, recommends that consequential analyses are required to determine “consequential life-cycle impact of the proposed policy is likely to reduce net GHG emissions. EPA notes this recommendation and claims its analysis is consistent with it, but EPA’s ad hoc treatment of fossil fuel displacement in the GLOBIOM case is inconsistent with this recommendation. National Academies of Sciences, Engineering, and Medicine. 2022. Current Methods for Life-Cycle Analyses of Low-Carbon Transportation Fuels. Washington, DC: The National Academies Press. https://doi.org/10.17226/26402. For additional discussion of model differences see comments on the EPA 2026-2027 RFS proposal submitted by Earthjustice and World Resources Institute.
[ix] Based on the difference between the High Volume and Low Volume scenario’s cumulative emissions from 2026 to 2055 excluding fossil fuel displacement divided by the difference in cumulative fuel volume in the same timeframe.
[x] Feng, Y., et al. 2022. Doubling of annual forest carbon loss over the tropics during the early twenty-first century. Nat Sustain 5, 444– 451. doi.org/10.1038/s41893-022-00854-3.
[xi] World Resources Institute. 2021. Global Forest Review.