
In the last decade, California was the epicenter of the renewable diesel boom, the biggest change in US biofuel markets in the last decade. However, while California is where renewable diesel consumption has grown most dramatically, the reasons for this growth go well beyond California policies. Supporting renewable diesel is costing drivers and US taxpayers billions of dollars a year, and using vegetable oil for fuel is a major driver of deforestation, so it’s well past time for a change. But to make effective changes in a complex policy landscape, we’ll need to follow the money. In this post I’ll do just that, looking at the different incentives that make it attractive for oil companies to turn expensive vegetable oil and animal fat into less expensive diesel.
There are at least five distinct incentives for oil companies to sell renewable diesel in California, which are sometimes described as the value stack or incentive stack. Federal tax credits are part of the stack, but it also includes compliance value under federal and state fuel policies and avoided compliance obligations associated with ultra low sulfur fossil diesel (ULSD) under state fuel or climate policies. Keeping track of the stacks can be tricky, especially right now, because the relevant policies are in flux. But tracking the stacks, and their evolution over time, helps explain how various policies collectively created the renewable diesel boom, why it centered on California, and why renewable diesel triggered a massive global trade in obscure commodities like used cooking oil. Looking forward, the evolving incentive stacks help us predict how California’s efforts to limit support for vegetable oil-based fuels will interact with Federal efforts to support the use of domestic soybean oil.
To make sense of it all, I made a spreadsheet tracking all the different incentives and how they stack up. I follow an approach similar to that described in a March 2025 post by Megan Boutwell, president of Stillwater Associates and I also drew from a recent paper by Jeff O’Hara, of U.S. Department of Agriculture’s Office of the Chief Economist. I examine the incentive stacks for renewable diesel made from several representative feedstocks sold in California, how they have changed over time, and how changes to federal tax credits, the Renewable Fuel Standard (RFS) and the Low Carbon Fuel Standard (LCFS) will change incentives in years to come.
The first thing that jumps out: how large total policy support for renewable diesel in California is. The incentive stacks averaged $3.20/gallon for the last decade, more than 50 percent above the wholesale price of diesel fuel in that timeframe. This amounts to support worth more than $400 per ton of avoided CO2 emissions. This is a very high carbon price compared to individual policy considered in isolation and it speaks to the overlap or stacking of several policies. This overlap also complicates the assignment of credit for blame among the different policies. To be clear, an incentive stack is not an estimate of consumer costs, nor is it a complete picture of the economics of different fuel pathways, since it says nothing about the costs of purchasing, transporting, and processing different feedstocks. But it is a critical piece of the puzzle.
Relative incentives for different feedstocks are also changing, and Federal and state incentives are increasingly pulling in different directions. The biggest changes in 2026 are new federal preferences for domestic feedstocks and for soybean oil. This is in tension with existing disincentives in California for soybean oil, which are ratcheting up with a cap on credits for vegetable oil-based diesel fuels going fully into effect in 2028. The disincentive for soybean oil, combined with logistical factors, had the practical effect of making California renewable diesel producers rely heavily on imports of used cooking oil and animal fats from overseas, at least until 2025. Going forward the changes in federal policy create a tug of war that will reshape the renewable diesel marketplace, although the outcomes remain uncertain because key policy decisions are not final.
My calculations are available for download, and I may update them after the US Environmental Protection Agency (EPA) finalizes the RFS mandates for 2026 and 2027. I welcome corrections or comments on anything I might have missed or gotten wrong.
Renewable diesel incentive stacks 2014-2024
Figure 1 shows the incentive stacks for renewable diesel made from soybean oil or used cooking oil (UCO) and how these have changed over the last decade, presented in nominal dollars (according to the Consumer Price Index, $1 in 2014 is worth $1.32 in 2024). While there are many different feedstocks and biofuel pathways for renewable diesel, these represent the range of support. First let’s take a walk through the stacks.
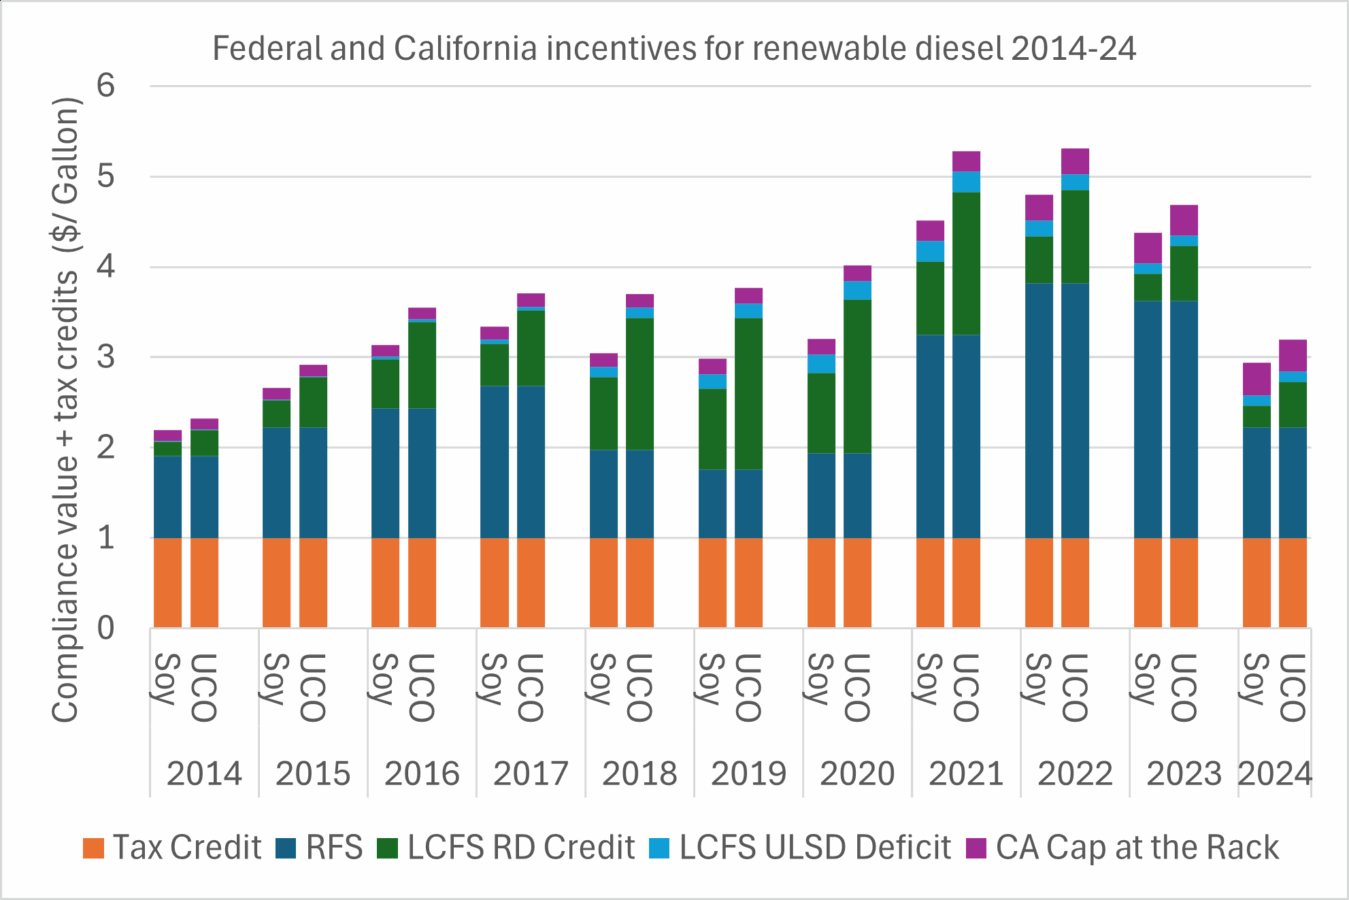
A gallon of renewable diesel sold in California is supported at least 5 ways with a total value that has ranged from $2.44/gallon in 2014 to $5.23/gallon in 2022. The individual components are described briefly below and in more detail in the linked spreadsheet. Some general observations follow.
- The federal tax credit. Federal tax policy provided a $1/gallon tax credit for biodiesel or renewable diesel from 2004 to 2024.
- RFS credits. The value of these RFS credits depends on RFS credit prices, called Renewable Identification Numbers (RINs), and specifically the D4 RIN for biomass based diesel, and also the equivalence value between a gallon of renewable diesel and a gallon of ethanol, which is set at 1.7 based on relative energy density. The RFS credit value for a gallon of renewable diesel is the same for all eligible feedstocks and has ranged from a low of 76 cents a gallon in 2019 to $2.82 a gallon 2022.
- LCFS credits for renewable diesel. LCFS credit generation depends on the LCFS credit price and the carbon intensity (CI) of each individual renewable diesel pathway relative to the CI of the LCFS standard. There are hundreds of unique pathways, but for a consistent and representative comparison of different feedstocks I used values from the 2025 Phillips 66 LCFS pathway report. CI scores are based on California’s version of GREET and also include indirect land use change (ILUC) emissions for crop-based biofuels. ILUC emissions for bio-based diesel fuels add 29.1 g CO2/MJ for soybean oil, 19.4 g CO2/MJ for canola oil, and 71.4 g CO2/MJ for palm oil. Secondary (inedible) fats and oils, including UCO, distillers corn oil and tallow, are not assessed ILUC emissions, and thus receive a greater incentive than vegetable oils. For soybean oil renewable diesel the value of LCFS credits peaked at $0.89/gallon in 2019-2020 and fell to $0.24/gallon in 2024, while renewable diesel made from used cooking oil peaked at $1.70/gallon in 2020 and fell to $0.51/gallon in 2024.
- LCFS ULSD deficit. Each gallon of renewable diesel that an oil company sells in California means they sell one less gallon of ULSD and thus incur fewer deficits. The value of these avoided deficits depends on the LCFS credit price and the stringency of the LCFS standard compared to ULSD. It peaked at 22 cents per gallon in 2021 and fell to 11 cents a gallon in 2024.
- CA Cap at the Rack. Renewable diesel fuel sold in California reduces an oil companies’ obligation to buy Cap and Trade (C&T) allowances. The value of this avoided obligation depends on C&T credit prices and has risen gradually over time to 36 cents a gallon in 2024.
Observations
- Total policy support for renewable diesel is very large. Between 2014-2024 the average incentive stack for soybean oil-based renewable diesel in California was $3.40/gallon. This is a large incentive compared to either the price of diesel fuel or the claimed climate benefits. The incentive stack is on average 50 percent higher than the $2.18/gallon wholesale price for diesel fuel in Los Angeles in that timeframe. Using the California Air Resources Board (CARB’s) estimated emissions benefits under the LCFS, the volume weighted average lifecycle emissions for renewable diesel between 2014 and 2024 were 61 percent lower than ULSD, delivering 8.1 kg CO2 equivalent reductions per gallon. This amounts to more than $400 per metric ton of avoided CO2 emissions. The high implicit carbon price results from several different policies supporting the same activity. These stacked incentives must also be considered in assigning climate benefits to the associated policies to avoid double counting. This is especially salient for the LCFS, for which the majority of compliance comes from biofuels that are also mandated by the RFS, and thus would still be used in similar quantities in the absence of the LCFS, although not necessarily in California. To avoid double counting, climate benefits attributed to biofuels used for LCFS compliance should be limited to emissions reductions in excess of those mandated by federal policy.
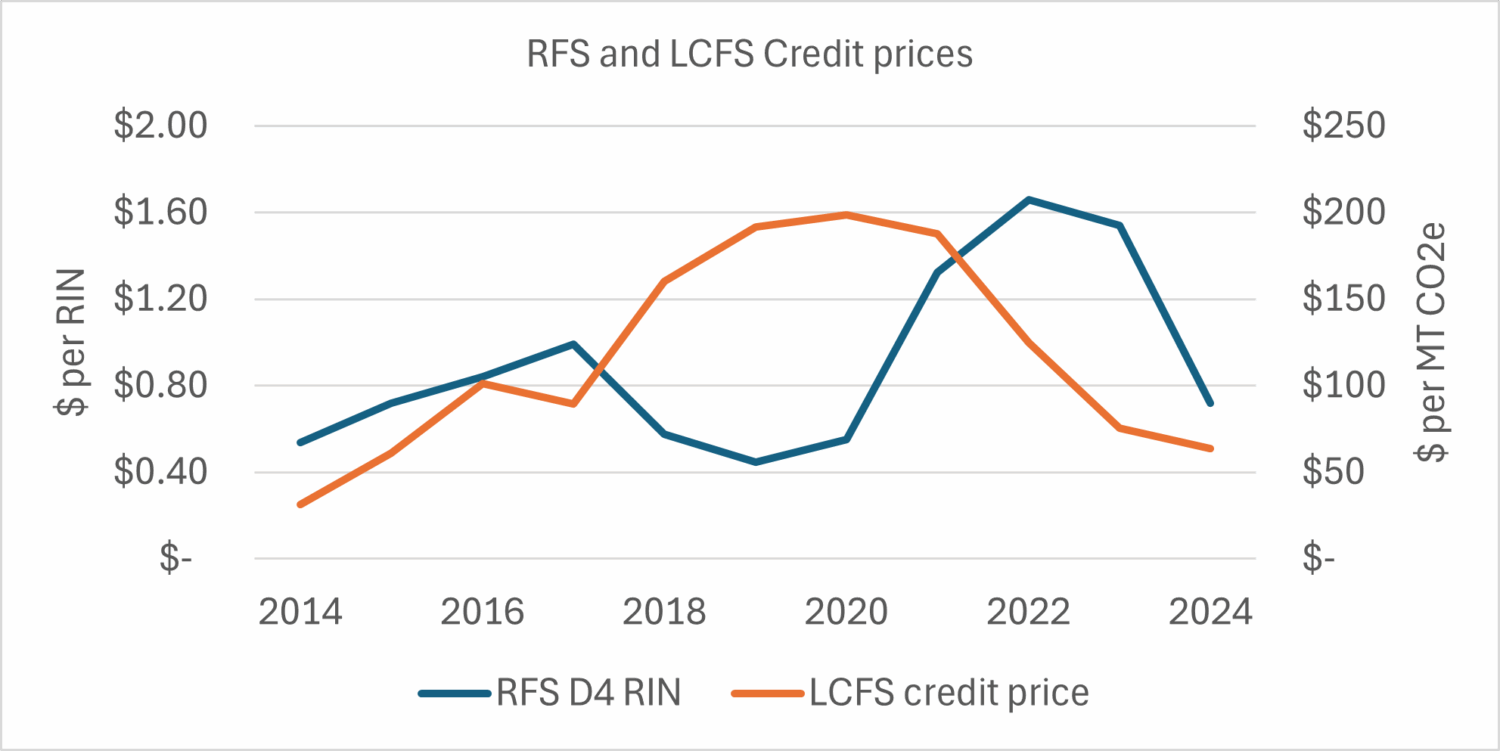
- Federal support for biofuels > California support. Federal policies provide the backbone of support for renewable diesel, without which renewable diesel production in the US might never have gotten off the ground. However, California policy support for renewable diesel is also substantial. The balance of federal versus California support depends mostly on the relative credit prices in the RFS versus the LCFS which have varied over time, as shown in Figure 2 below. On average, federal support for renewable diesel has been twice as large as California incentives, although for a few years from 2021 to 2023, when RIN prices were low and LCFS prices were high, California incentives were nearly equal to federal support.
- Indirect land use change (ILUC) emissions are important on the margin. ILUC emissions assigned to crop based fuels in the LCFS result in a preference for UCO over soybean oil-based fuel that has varied over time, depending on LCFS credit prices. The differential peaked in 2020 at 81 cents per gallon, which was 20 percent of the total UCO incentive stack. The differential declined as LCFS credit prices fell, reaching 26 cents in 2024 or 8 percent of the UCO stack.
- LCFS credits are only part of California policy support for biofuels. While LCFS credits are the most obvious and direct source of support in California policy for renewable diesel, there are other less direct sources of support that are growing more important over time. Selling renewable diesel reduces compliance obligations associated with ULSD diesel under both the LCFS and C&T. This portion of the incentive stack is independent of the CI score of the renewable diesel and grows in relative importance over time. In 2018 avoided ULSD compliance obligations accounted for a quarter of California support for soybean oil renewable diesel, but by 2024 these had grown to two thirds.
- California support effectively favors renewable diesel over biodiesel. The incentive stack for biodiesel is similar to renewable diesel, and generally biodiesel is less expensive to produce than renewable diesel. However, blending constraints limit how much biodiesel can be used in California. Because renewable diesel is not subject to these blending constraints, replacing biodiesel with renewable diesel allows more of the federal RFS obligations to be satisfied in California, where it can generate additional support. The additional support far outweighs the marginally higher costs associated with producing renewable diesel.
Changes in federal policy encourage domestic feedstocks and fuels
After a decade in which the main policy drivers were stable, policies started to change in 2025. The major changes are described below. The forward-looking incentive stack is uncertain because of uncertain credit prices in the RFS, LCFS and Cap and Trade and because the RFS final rules have not been finalized. 2024 and 2025 are based on reported credit prices, and for 2026 I made simple assumptions in round numbers ($1/RFS D4 RIN, $75/MT LCFS Credit price and $30/MT Cap and Trade).
- The federal tax credit. In 2025 federal biofuel tax credits changed from the long standing dollar a gallon tax credit to the 45Z clean fuel production tax credit, which is awarded on a sliding scale based on CI according to a new version of the Argonne GREET model called 45ZCF-GREET, and also featured higher tax credits for jet fuel versus diesel fuels. In 2025, just as the 45Z credit was going into effect, the US Treasury announced that imported UCO would be ineligible for the 45Z tax credit because of concerns about mislabeling of virgin palm oil as UCO. Later in 2025, Congress amended the 45Q tax credit removing the premium for jet fuel, limiting eligibility to fuels made from North American feedstocks, and excluding ILUC from consideration. Excluding ILUC increases the value of the tax credit for soybean renewable diesel from 20 cents a gallon in 2025 to 50 cents a gallon in 2026.
- RFS credits. The proposed RFS standards for 2026-2027 would cut credit generation for imported fuels and feedstocks in half (half RIN) and reduce the equivalence value of renewable diesel from 1.7 to 1.6 RINs per gallon. Because there is some uncertainty over whether EPA will preserve the half RIN proposal, I have evaluated the RFS with and without the half RIN discount. For 2026 and beyond I have assumed a biobased diesel (D4) RIN of $1.
- LCFS credits for renewable diesel. For 2026 and beyond I have assumed LCFS credit prices of $75 per metric ton CO2 equivalent (MT CO2e). The other major change in the LCFS is a limit on credit generation for vegetable oil-based fuels to 20 percent of production. This change went into effect in July of 2025, but for producers with existing pathways, the change takes effect in 2028.
- CA Cap at the Rack. For 2026 I assumed C&T allowance prices are $30/MT CO2e.
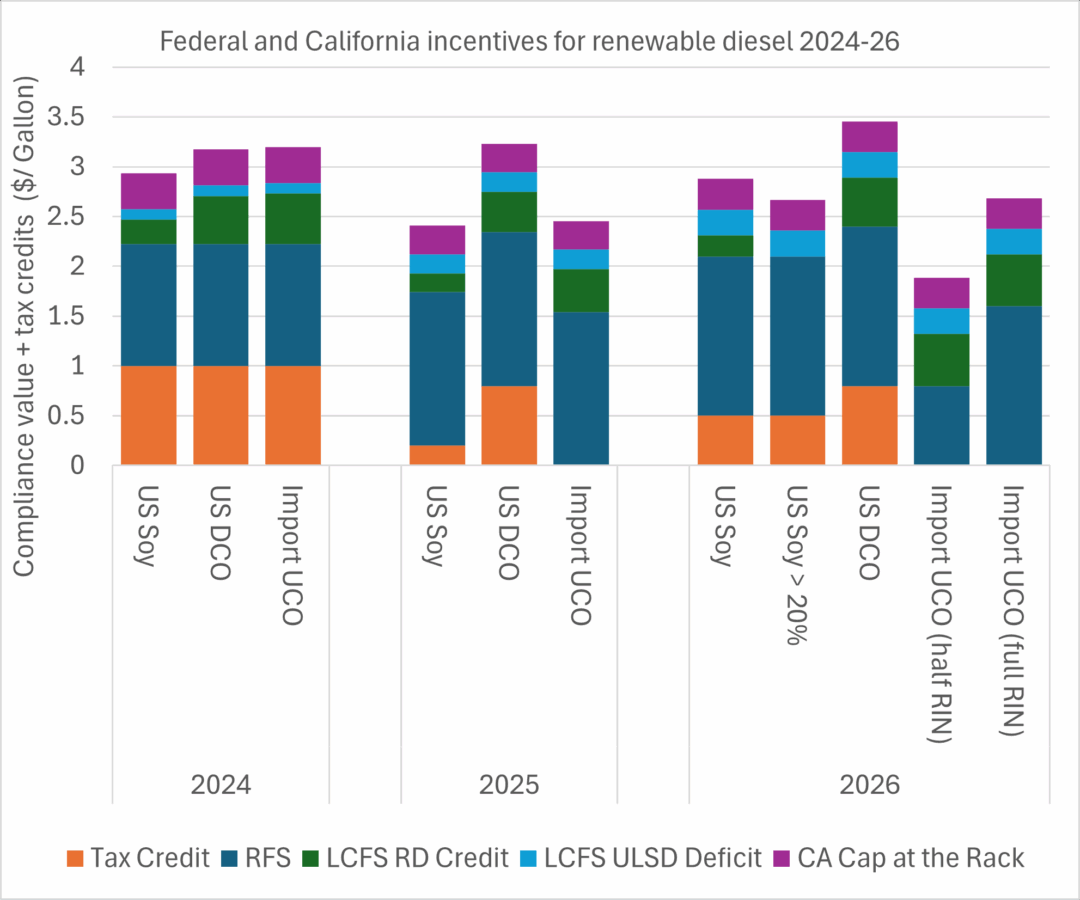
Figure 3 illustrates the impact of these changes on the incentive stacks in 2024, 2025 and 2026. The figure includes three key feedstocks: US soybean oil, US distillers corn oil (DCO), and imported used cooking oil (UCO). Prior to 2025, US DCO and imported UCO had very similar incentive stacks, but as county of origin enters the picture, these stacks start to diverge. For 2026 I compared the incentive stacks for imported UCO with either full RINs and half RINs, representing two plausible outcomes of the RFS final rule. For 2026 I also illustrate the impact of the LCFS cap on credit generation to 20 percent of the feedstock for a bio-based diesel producer. However, for companies with existing pathways, the 20 percent limit does not become effective until 2028[i] (see the LCFS regulation section 95482(i) for details).
Observations:
- The favored position of imported UCO is over. With the federal incentives discouraging imports, imported UCO shifts from the largest incentive stack in 2024 to among the smallest in 2026. The extent of disadvantage depends heavily on the final half RIN decision. If EPA finalizes the half RIN discount as proposed, the imported UCO stack will be $1/gallon less than US soybean oil, while if EPA drops the half RIN discount the disadvantage will be just $0.19/gallon. If EPA finalizes the half RIN, biofuel producers will have a very large incentive to secure domestic feedstocks, and even fairly costly shuffling of domestic feedstocks out of existing uses to fuel production will be economic. If EPA drops the half RIN, however, the difference in incentive stacks will have to be weighed against differences in transportation costs. This will be especially important for West Coast renewable diesel producers that can receive international feedstock imports by ship but would likely need to receive domestic feedstock by either rail or Jones Act ship, which could add significantly to costs.
- Distillers corn oil comes out on top, but potential growth is limited. US DCO is the clear winner from changes in federal tax policy, since it receives a significant preference in California as a secondary oil, and a large preference in federal policy as a domestic feedstock. However, the larger incentive may not lead to dramatically higher use, because the supply of US UCO is limited, most of it is already used for biofuel production, and the ability to increase production is limited. In 2024, California consumed 390 million gallons of DCO renewable diesel and another 48 million gallons of DCO biodiesel which amounted to more than three quarters of US DCO production in 2024. A similar incentive would apply to other domestic fats or UCO, not shown here1.
- Soybean oil is the feedstock that is both available and policy advantaged. Soybean oil is the only domestic feedstock available at adequate volumes to replace a large share of the feedstocks and fuels that were imported in 2024 (~9 million metric tons of oils, fats and imported fuels). However, moving soybean from the Midwest to California would add costs. Rail seems the most likely route, and based on this price list I estimate this would cost about $0.34/gallon. Moving feedstock by ship is generally less expensive, but limitations on Jones Act tankers could limit the quantity of US soybean oil that could be moved to California by ship.
- The cap on LCFS credits for soybean oil diesel will have a limited impact. The limitation on LCFS credits for vegetable oil-based diesel fuels, which for most firms does not go into effect until 2028, is likely to have only a marginal impact on the stacks. LCFS credits account for only 7 percent of the total incentive stack for soybean oil, and the cap does not affect avoided ULSD deficits and CA Cap at the Rack. The loss of the LCFS credits is offset by the 45Z preferences for domestic feedstocks, so that the incentive stack for soybean oil is about the same as imported UCO with a full RIN. If the half RIN proposal is finalized, domestic soybean oil’s incentive is $0.78/gallon higher than imported UCO.
Concluding thoughts
Examination of incentive stacks can shed light on a complicated situation, but they are only part of the story. Feedstock costs, availability, tariffs and logistics will also play an important role in determining which feedstocks are used and in what quantities. Future incentive stacks are uncertain because they depend upon credit prices for all the relevant policies. However, two tentative conclusions are possible.
First, if EPA finalizes the half RIN proposal, the impact on imported feedstocks will likely outweigh all other factors, which will put biofuel producers without access to domestic feedstocks at a substantial disadvantage. The difference in incentives will be large compared to logistics costs and result in substantial shuffling of domestic feedstocks out of non-fuel uses to fuel production, with food and other non-fuel uses of feedstock switching to imported oils and fats. If EPA drops the half RIN, the differences in incentives will be smaller, and will have to be balanced against feedstock costs, availability and logistics costs.
Second, the LCFS cap on credits for vegetable oil feedstocks is a more subtle policy intervention than the term “cap” might suggest. Even when it is fully effective in 2028, vegetable oil-based diesel fuels beyond the cap will still receive significant California policy support and combined with federal incentives and the greater availability of domestic soybean oil relative to secondary fats and oils, the use of soybean and canola in California may continue to grow2. Moreover, the cap does not apply to bio-based jet fuel, which could lead to increased California vegetable oil-based fuel consumption, especially if California or the federal government adds additional policy support for bio-based jet fuel.
- According to recent estimates from USDA, there are significant domestic quantities of animal fats, UCO and grease in excess of those currently used for fuel production that could be used for increased bio-based diesel production if they can be collected and/or diverted from their existing uses. ↩︎
- Canola oil imported from Canada could become more attractive for use in California, especially if EPA drops the half RIN proposal, because it is eligible for the 45Z tax credit, it has a lower ILUC score than soybean oil in the LCFS and it can be shipped from Canada’s west coast without requiring a Jones Act ship. ↩︎