
This blogpost was co-authored with Sital Sathia
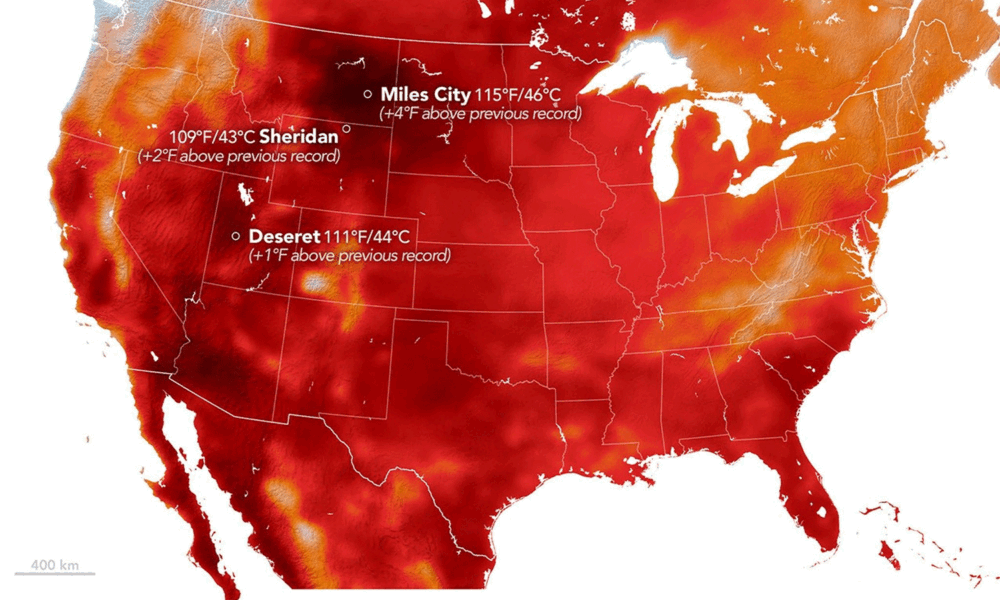
As anticipated early in the year, 2026 broke all sorts of temperature records. A rapidly intensifying super El Niño, now the strongest on record combined with a perfect storm of killer heat brought on by the climate crisis, drove energy prices so high it sparked an affordability crisis, putting people at higher risk. With the hottest average temperatures on record this summer, the US also notched the highest need for cooling in 48 states. That combination of extreme heat and rising energy prices affected those who could least afford it during the 2026 Danger Season, the months between May and October when North America experiences some of the worst extreme weather due to fossil fuel-caused climate change. And, very likely, the worst is yet to come in 2027, when the Super El Niño is expected to bring warmer global temperatures, which could fuel more intense heatwaves in the US.
Most of us were hit with extreme heat in 2026
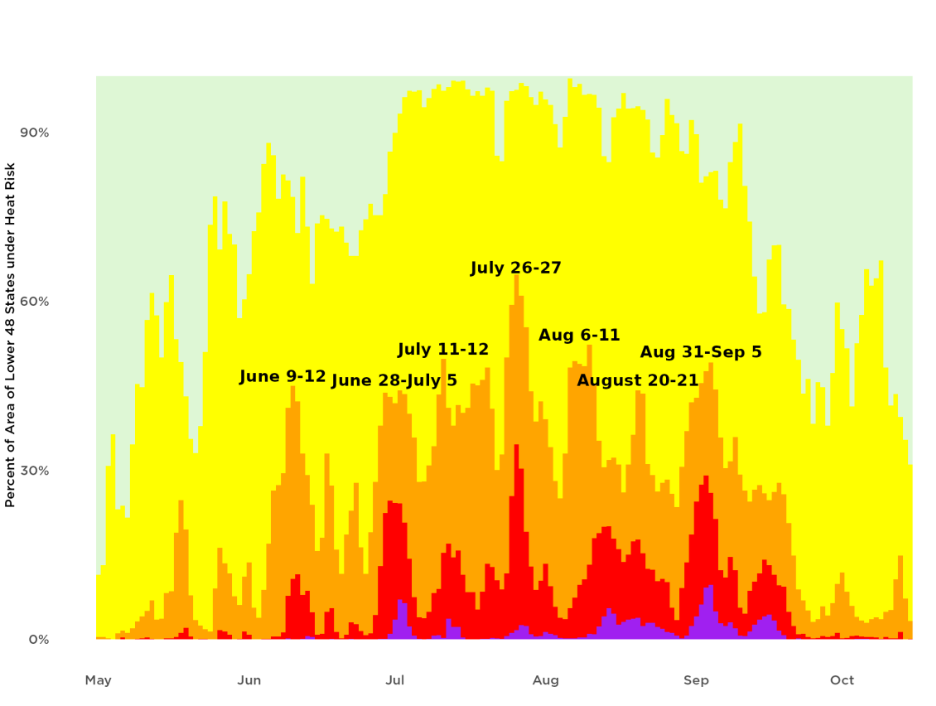
In the US, 94.6% of the total population in the lower 48 states experienced major or extreme heat risk at least once during the 2026 Danger Season. These two heat risk categories are the most dangerous especially for anyone without cooling or hydration, according to the National Weather Service. The figure below, assembled from archived data provided by the National Weather Service’s Heat Risk Tool, shows that during the 2026 Danger Season, there were seven multiday heat episodes where between 30% and 63% of the area of the lower 48 states was under at least moderate heat risk (represented by the orange, red, and purple bars)—an area equivalent roughly to 3-7 times the size of Texas. While moderate risk is not as severe as the major or extreme categories, it can still threaten those who are sensitive to heat.
Cooling needs rose in places where AC is less affordable
As heat becomes more intense and persistent, staying safe increasingly depends on access to reliable cooling. But having air conditioning alone is not enough: households also have to be able to afford the energy it takes to power it. Census data show that about 9.2 million US households lacked an AC unit in 2023, while millions more reported experiencing uncomfortably hot indoor temperatures even when cooling equipment was present.
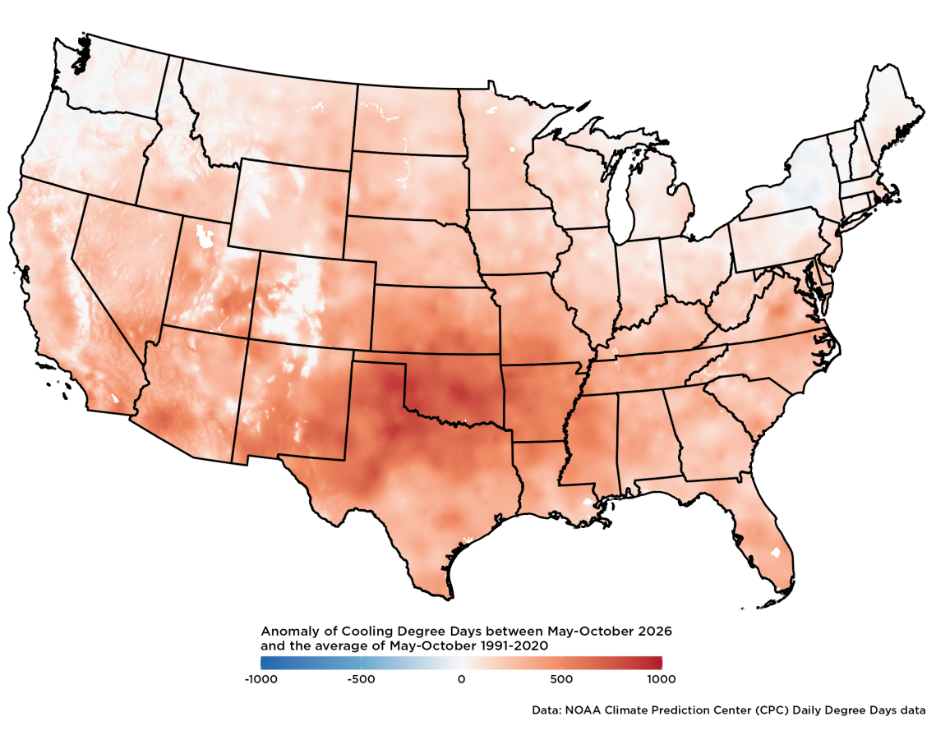
In 2026, that need for cooling was especially pronounced. The 2026 Danger Season had the highest average number of cooling degree days across the lower 48 states. Cooling degree days (or CDD) measure how much temperatures exceed 65°F and are used to estimate cooling needs. The higher the CDD, the greater the need for air conditioning and potentially the higher the energy demand. CDD do not measure actual household electricity use or bills, but they help show how sustained cooling demand was this summer.
The map below shows how 2026 Danger Season’s CDD compared with the average for Danger Seasons past. Almost everywhere in the lower 48 states there were many more CDD during the 2026 Danger Season than during the 1991-2020 Danger Seasons. This shows clearly that cooling demand rose this year due to more heat. In fact, in 97% (or 233 out of 241) of major US cities analyzed by Climate Central, cooling degree days were on average 37% higher than in the 1970s.
And some of that need showed up in electricity use. Residential electricity consumption was 6% higher in the third quarter of 2026 than during the same period in 2025, according to US Energy Information Administration (EIA) estimates, in part because hotter weather increased cooling needs.
While these estimates reflect total summer electricity spending, not the cost of air conditioning alone, they underscore the growing financial pressure households face as staying cool becomes increasingly essential. And of course, rising electricity costs do not affect every household equally.
That’s where energy burden, one measure of energy affordability, becomes important. Energy burden is the share of household income spent on home energy, and 6% or greater is considered high energy burden.
Using 2022 data prepared by the Energy Equity Project (EEP) from the Department of Energy’s Low-Income Energy Affordability Data tool (DOE LEAD), we found a substantial divide by income. That inequity was evident whether income differences among households were assessed based on the federal poverty level (FPL) or the Area Median Income (AMI). The table below clearly shows that average energy burdens are much greater for lower-income households than for households with higher incomes.
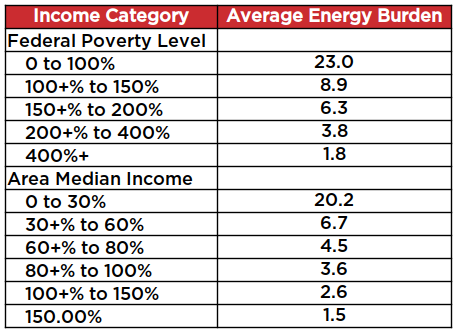
These burden estimates help show which households were already facing energy affordability challenges before the extreme heat of 2026 and point to an important inequity: households with the fewest financial resources are devoting substantially more of their income to meeting basic home energy needs. When dangerous heat persists for weeks and keeping homes at safe temperatures can mean using more electricity, working families are faced with impossible choices, having far less room in those household budgets to absorb another expense.
Having AC doesn’t mean you can afford to run it
But the energy burden only tells part of the story. It tells us how much households spend relative to their income, but it does not necessarily tell us whether they are able to access all the energy they need. Some households cope with unaffordable energy costs by using less energy than they need, turning up the thermostat, cooling only part of the home, or going without air conditioning altogether.
And there are differences in how households with different income levels deal with cooling needs. For example, the difference in the temperature at which lower and higher-income households turn up the AC is defined as the energy equity gap. In Arizona, it was estimated that low-income households wait longer to turn up the AC, typically waiting for outside temperatures that are 4.7°–7.5°F (2.6°–4.2°C) hotter than higher-income households. Researchers argue that these kinds of energy-limiting behaviors can remain hidden in conventional measures of energy affordability. A relatively low bill may reflect affordability, but it may also mean that a household is going without the energy it needs to remain comfortable and safe.
That distinction matters during extreme heat. While energy burden measures how much of a household’s income goes toward energy bills, energy insecurity reflects the broader struggle to meet basic energy needs, whether because of high costs, unreliable service, or inadequate heating and cooling.
Recent federal data underscore that millions of households experienced some form of energy insecurity in 2024, including unhealthy indoor temperatures and an inability to use AC. And as energy justice scholar Dr. Tony Reames has emphasized, the underlying premise of addressing energy insecurity is that “energy is a basic human right.” During dangerous heat, that principle becomes especially tangible: electricity can be essential to keeping a home at a safe temperature. Yet whether households can use enough of it to protect their health still depends, in part, on whether they can afford the bill.
So where did the repeated dangerous heat of 2026 overlap with places where households were already facing greater energy-affordability challenges?
Rising cooling demand in energy-burdened communities
Above we showed how much higher cooling demand was in the 2026 Danger Season compared to recent decades. But how did that heat overlap with energy burdens? In the map below, we combined the Cooling Degree Days anomaly map with fine-scale energy burden data to assess the overlap of dangerous heat and energy burdens in 2026, and we found that it was substantial. The most frequent dangerous heat in 2026 coincided in communities with already-high electricity burdens, adding another layer of vulnerability to staying safely cool.
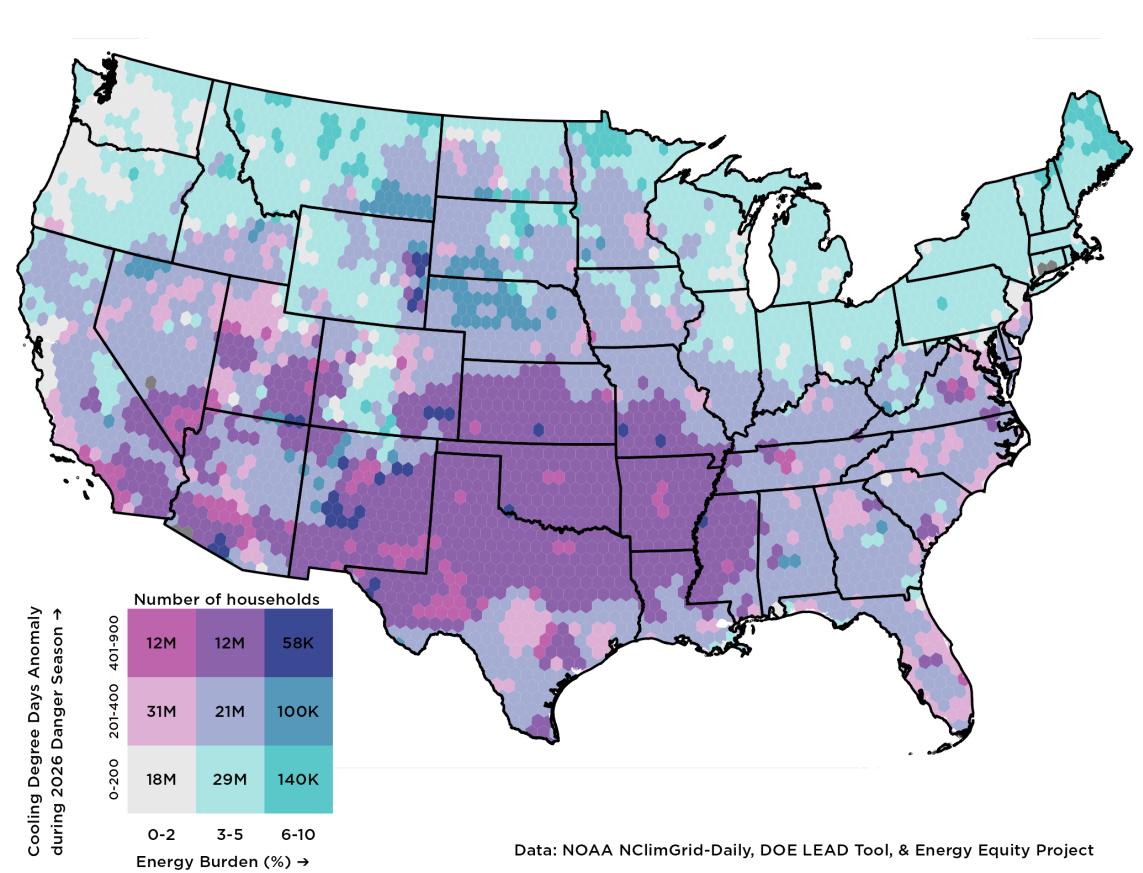
The dark pink and purple areas clustered in the Southern Great Plains and parts of the Southwest contain about 24 million households that experienced the largest increases in cooling demand during 2026, (between 401-900 more than during 1991-2020). Most of these have energy burdens of 0-5%, but there are scattered areas in the central and western parts of the country in dark blue with the largest increase in CDD and also the highest energy burden (6-10%).
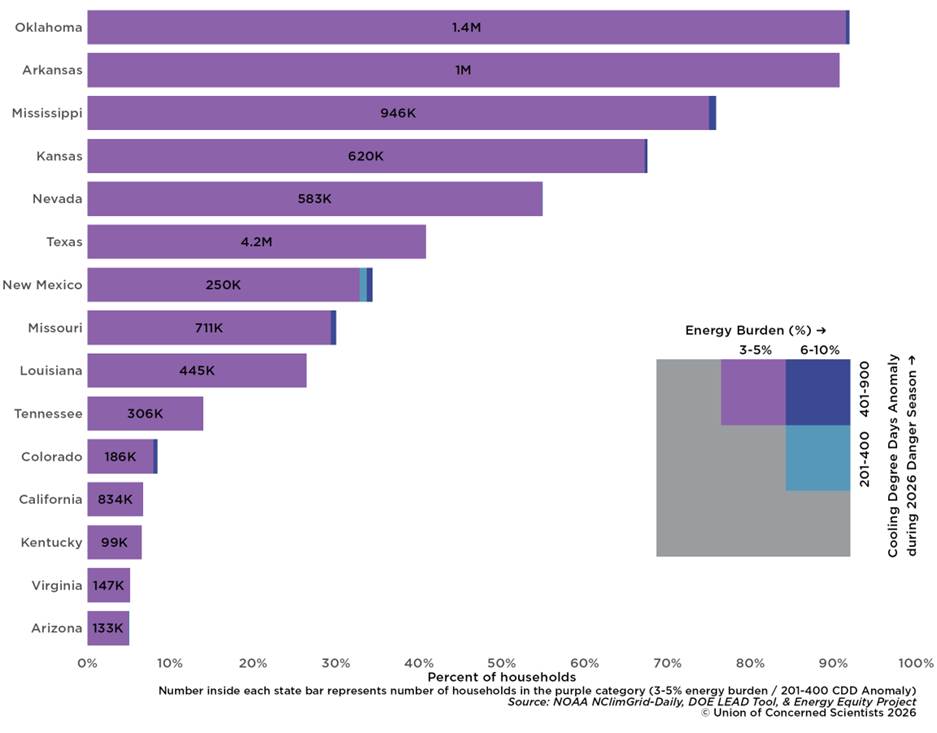
For households already devoting a meaningful share of their income to home energy, repeated periods of dangerous heat can leave even less room to absorb the additional electricity cost needed to stay safely cool. Taken together, the map shows that the risks intersect in different ways across the country: some communities faced repeated dangerous heat, others greater energy affordability pressures, and millions of households faced both. What does it look like in states with large fractions of households in the highest combinations of cooling demand and energy burden? Below we sliced the top 15 states by percentage of households in the top-right quadrant of the combinations on the previous map. These are the combinations of the highest CDD anomalies and medium energy burden (purple), the highest energy burden and medium CDD anomalies (steel blue), and the highest values on both (dark blue). They represent about 12.2 million households across the country. In four states (Oklahoma, Arkansas, Mississippi, Kansas, and Nevada), households in the 3%-5% energy burden bin and the highest CDD anomaly (401-900) represent at least half of all households in each state.
Compounding events increase heat risk
While there were chronic exposures to heat this Danger Season, acute extreme weather events also piled heat-related risks on vulnerable and marginalized communities. Perhaps the most illustrative case of 2026 is the derecho (a widespread, long-lived storm with powerful winds that moves in a straight line) that knocked out power in mid-August for many in Indiana. But it was the people of Gary, a predominantly Black community in the state, who were left without power for 2-3 weeks after the storm. Many in the town faced indoor temperatures of about 85°F—without AC.
The country’s crumbling electrical transmission infrastructure that is not hardened to withstand extreme weather combines with the egregious callousness of systemic racism that neglects not just emergency repairs during blackouts, but also electricity infrastructure investments in Black and Brown communities. Recent UCS research has shown that a rigorously-planned, reliable, and climate-resilient grid can help reduce energy burden disparities.
What can households expect to face in 2027?
A record strength Super El Niño is unfolding on top of the long-term warming caused by fossil fuel-driven climate change, and climate scientists expect global temperatures to remain high in 2027, increasing the likelihood of extreme heat events that are longer, deadlier, and that in some cases hover around places for days, creating repeated dangerous heat conditions.
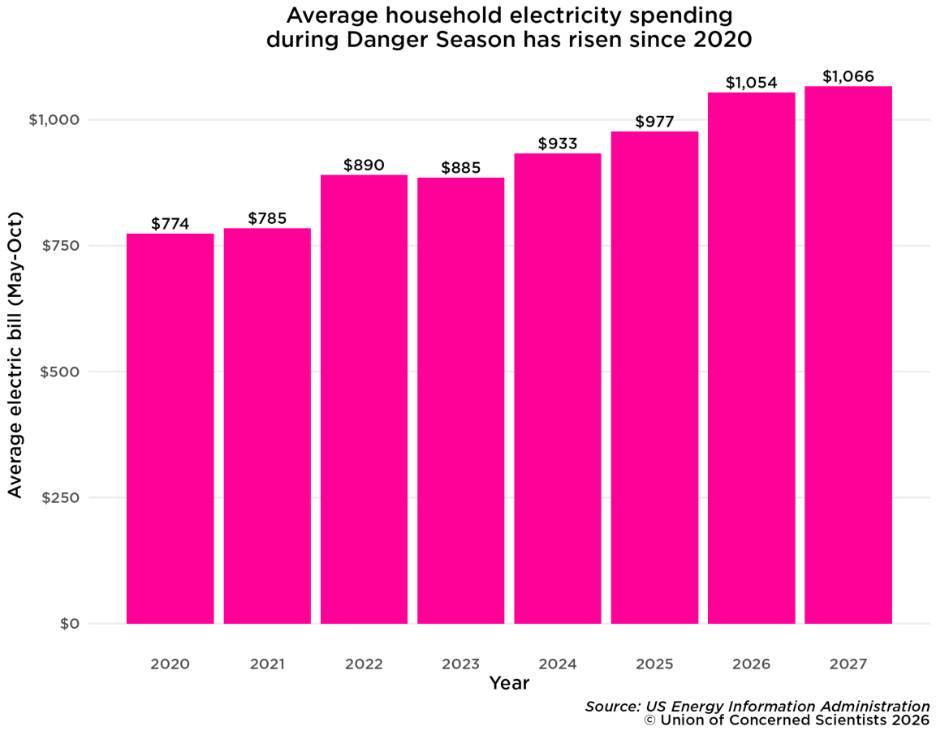
At the same time, households are also heading into 2027 weighed down by several years of rising electricity prices. In a 2026 PowerLines/Ipsos survey, 61% of utility billpayers said their energy bills were adding to their financial stress, and 77% are concerned their bills will rise again this year. Among households earning less than $50,000 a year, nearly half reported difficulty budgeting for their monthly gas and electricity bills.
EIA now forecasts the national average residential electricity price will rise by another 2.6% in 2027 from 2026, bringing projected 2027 prices to nearly 8% above 2025. That increase will not translate into the same bill change for every household. But when dangerous heat increases the electricity needed for cooling, rising prices can further squeeze households that are already having difficulty making their energy costs fit within their budgets.
The exact heat levels we will face in 2027 are uncertain. What is clear is that millions of households are entering another year of increasing climate risk while already struggling with energy affordability and no relief on the way.
How to address these threats
Future Danger Seasons will arrive in a climate that is fundamentally changed, with households and communities carrying very different levels of vulnerability into it. We may not be able to predict every detail of what comes next, but we already know a good deal about what helps people stay safer through extreme heat—and what makes the risks worse.
The recent mid-term elections clearly demonstrated that the US electorate connected the dots between the energy and affordability crises and rejected the politicians and policies that are worsening unaffordability of all aspects of life in the country by supporting fossil fuel interests.
And we already know many of the things that can help. There are programs and policies designed to make energy more affordable, homes safer, and communities more resilient, for example:
- We can protect and strengthen programs such as the Weatherization Assistance Program (WAP), which helps lower-income households reduce energy use and costs through home efficiency improvements.
- We can expand and improve the Low Income Home Energy Assistance Program (LIHEAP), which help households manage home energy costs and can provide assistance during times of need.
- We can expand access to safe and affordable cooling and to clean energy options such as community solar. Pairing renewable energy with storage can help homes, community facilities, and microgrids keep essential power available when the larger grid goes down.
- We can strengthen protections against utility disconnections when losing electricity can itself become a health and safety risk, while investing in a grid that is more reliable and resilient under increasingly extreme conditions.
Across all these efforts, communities, particularly those that have historically borne greater energy burdens, received fewer clean infrastructure investments while also being overburdened with polluting fossil-fueled infrastructure, should have a meaningful role in deciding what gets built, where investments go, and what resilience looks like for them.
We can plan for extreme heat as something we know will continue to happen every year, rather than waiting until people are already in danger to respond. And we can continue working to reduce the climate pollution that is driving more dangerous heat in the first place.
While we cannot prevent every extreme heat event or every disruption, we can shape what happens when they arrive: whether homes can stay safely cool, whether an unexpected bill becomes a crisis, whether the power stays on, and whether communities have the resources they need to recover.
And that is where the possibility of a different outcome begins.
Preparing equitably means investing most where the risks are greatest, while strengthening the systems we all rely on. When homes are safer, energy is affordable, communities have a voice, and the grid is more resilient, we are all better prepared for what comes next.
We may not be able to predict exactly what the next Danger Season will bring, but science can help us prepare for what is ahead. With equity as our guiding principle, we can make choices to reduce the risk of climate change while ensuring that everyone is able to stay safe.
As housing and energy advocate Mary Wambui recently reminded us in a conversation, “equity is for everyone.” This is a principle we should adopt as we prepare for uncertain climate realities. Addressing the inequities that leave some households struggling to afford energy or stay safely cool does more than reduce those disparities. The same investments that will lead to healthier and more efficient homes, reliable electricity, a resilient grid, better consumer protections, and communities that are better prepared for extreme weather, will strengthen the systems all of us rely on.