
For the past ten years, the electricity grid in the central United States has been telling us a story quietly, consistently, and honestly, in the dark.
Tuning into that story began with asking a simple but essential question, one that kept resurfacing in our conversations as we grapple with the climate crisis: as climate change increases the frequency and severity of extreme weather events, what does that actually mean for our power grid—and for the people who rely on it?
Extreme weather means extreme power outages
To begin answering that in the context of MISO, the regional grid operator that manages the flow of electricity across the central United States and the Canadian province of Manitoba, the Union of Concerned Scientists (UCS) and collaborators started with something tangible and measurable: power outage data. We focused on large-scale power disruptions that have affected the region over the last decade, linking them with an analysis of media reporting to identify which weather events were associated with the most significant impacts, and when, where, and why those disruptions occurred.
It’s worth pausing here to clarify how we’re using the term extreme weather. According to the Intergovernmental Panel on Climate Change (IPCC), extreme weather events are those that are rare for a particular place and time of year—events that fall outside historical norms, often defined statistically as occurring in the outer tails of past observations. NOAA similarly treats extreme events as weather phenomena that deviate significantly (e.g., within the highest or lowest 5 or 10 percent of historical measurements) from historical conditions or meet defined hazard thresholds, documenting them through observed impacts in their storm events database.
These definitions matter because extreme weather is not a fixed category. In grid planning and climate science alike, “extreme” is defined relative to historical experience. But as the climate changes, those baselines are shifting. What was once rare is now recurring. Events that used to sit at the margins of planning assumptions are increasingly part of the conditions under which the grid must operate.
In the new UCS report, Power After the Storm: Achieving Grid Resilience in a Climate-Changed World, we look backward to make sense of how historically extreme conditions have already strained the grid. The patterns were hard to ignore: each of the top 100 worst outage days was driven by a large-scale extreme weather event.
And as climate change intensifies weather extremes such as severe thunderstorms, heat waves, and extreme precipitation, these outages aren’t just becoming more common—they’re becoming deeper, more layered, and more consequential for the people who already carry the most risk. Which raised a bigger question for us: how does the length of power outages relate to a county’s social vulnerability?
The communities most impacted by outages
To answer that question, we looked at the average number of outage days across counties from the report, alongside the US Center for Disease Control and Prevention’s Social Vulnerability Index (SVI). The SVI captures the relative concentration of social and structural conditions (e.g., high poverty, low percentage of vehicle access, or crowded households, among others) that can limit a community’s ability to prepare for, respond to, and recover from hazardous events.
We combined county level SVI data from 2022 with our outage analysis, grouped counties by their level of social vulnerability, and compared outage burden across these groups by calculating the average number of days in which at least half of county residents went without power over the last decade.
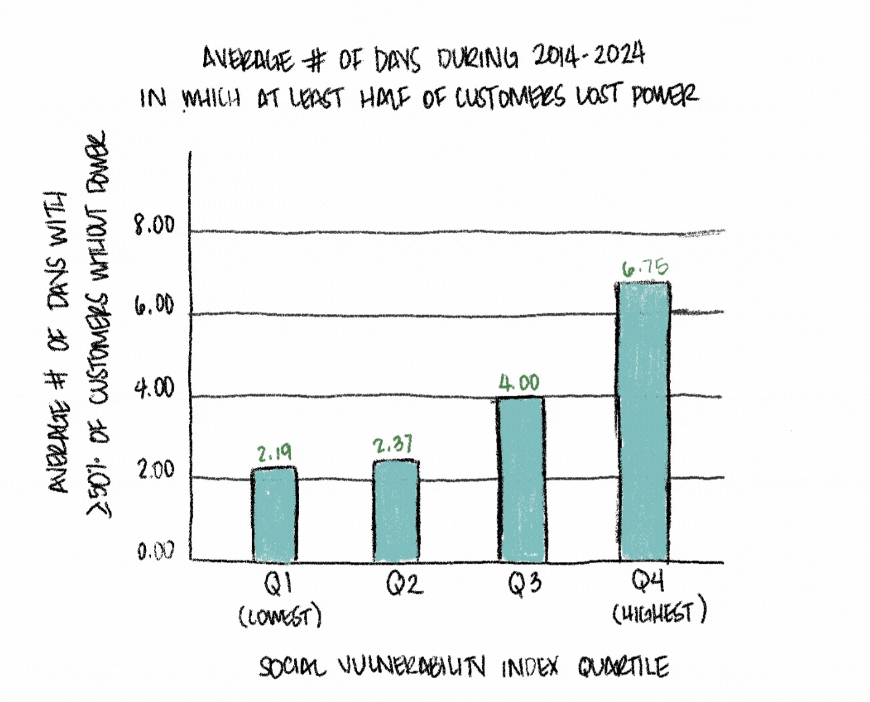
Source: EAGLE-I Power Outage Data, 2024 and CDC/ATSDR Social Vulnerability Index (SVI), 2022
The data shows that counties in the highest SVI, those counties with the highest levels of vulnerability (quartile), experienced more than twice as many days in which at least half of customers lost power as counties in the lowest quartile, underscoring that social vulnerability is closely associated with a greater outage burden. These are communities navigating language barriers, disability, housing insecurity, income constraints, and transportation gaps—while also absorbing the longest stretches without power.
It’s a visual reminder that the people already carrying the most are also the ones spending the most days in the dark.
And it’s important to sit with what outage days actually mean.
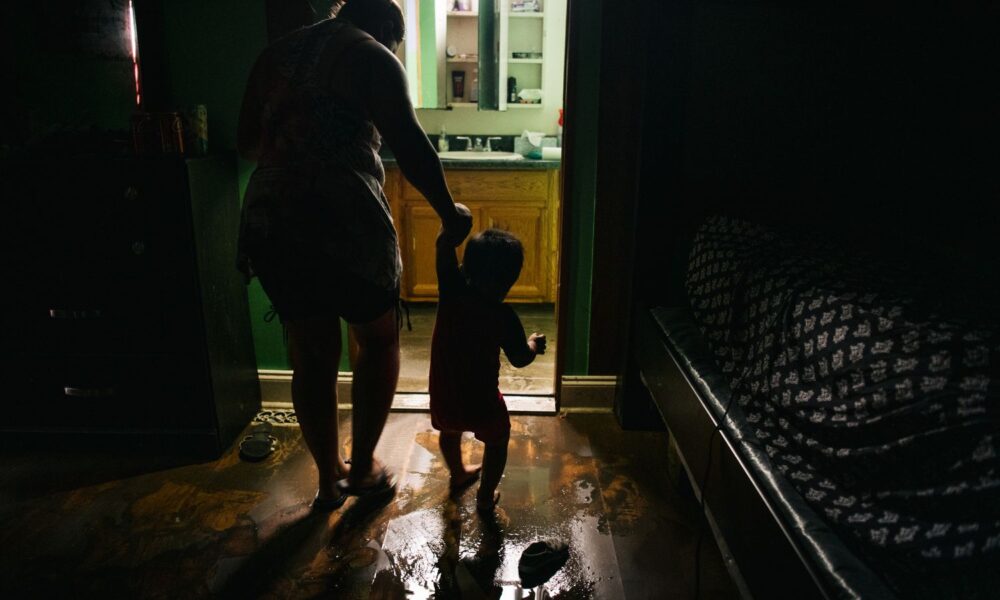
These aren’t just technical interruptions. These are days when food spoils and routines unravel. Days when people have to figure out how to keep insulin cool. Days when neighbors knock on doors to check on elders, and when kids try to finish homework by flashlight.
To be clear, no power system can prevent every outage during extreme weather. Some disruption is inevitable when storms hit with force. However, prolonged, widespread outages—especially those lasting days or weeks—cannot be the status quo. They reflect decisions about where to harden infrastructure, which neighborhoods are prioritized for restoration, and whether to plan for recovery or prevention.
We know this because it doesn’t look this way everywhere. In some places, policies require utilities to prioritize restoration for people with medical needs and other high vulnerability indicators—and even to conduct direct check-ins during outages to ensure safety. These approaches don’t eliminate risk, but they recognize that duration is not neutral. Duration matters. In too many places, long outages have become an accepted outcome rather than a failure to be remedied.
Outages don’t happen in isolation
When we examined the region’s worst outage events more closely, another pattern emerged. They weren’t single-incident storms. They were often compound disasters: derechos layered with tornadoes, hurricanes followed by heat waves, winter storms tangled with flooding. Some hit the same communities again before recovery was even possible. Climate change isn’t just increasing extremes: it’s shrinking the duration between them.
At least in part because of climate change, all ten of the most significant power outage events over the decade occurred since 2020. While the fingerprints of climate change have not been studied for all of the events, human-caused climate change worsened the 2020 hurricane season that brought about three of the ten most consequential outages for the region. This marks a break from the past—a moment when extreme outages ceased to be occasional shocks and became a recurring feature of the system.
Planning assumptions built on earlier decades no longer reflect the risks communities face today. The worst outages are not behind us; they are recent and recurring.
The geography of those outages tells a familiar story. Counties with the longest disruptions follow the contours of areas with challenges in housing access, pollution burdens, transit gaps, and disaster recovery.
The grid is not separate from those histories. It reflects them.
This analysis’s findings about outages not being experienced evenly support what many communities have long known. They also fit with the many other studies that have found that socially vulnerable and marginalized communities experience more frequent and more severe power outages. Beneath those outages are harms that rarely appear in official records. Many deaths linked to extreme weather outages, from carbon monoxide poisoning, extreme heat, prolonged cold, or medical equipment failure, occur during outage conditions. The human toll is both larger and quieter than the public record suggests.
We have the solutions needed to keep the lights on
This trajectory is not inevitable. In places where resilience investments have been intentional—community microgrids, solar paired with battery storage, and decentralized energy systems—outages have been shorter and less disruptive, even during severe weather. After Hurricane Maria, solar-and-storage microgrids helped keep clinics and community centers powered in Puerto Rico. In parts of California and the Northeast, microgrids and backup systems have enabled critical facilities to continue operating during wildfires, heat waves, and winter storms. These examples show that when resilience is designed into the system, the lights don’t have to stay out as long.
This work adds a regional lens: a way to see these national patterns clearly within the MISO+ footprint—the same region where many of the country’s most consequential transmission and resilience decisions are now being made. Choices made here today will shape the safety and stability of communities for decades to come. If we don’t build for a hotter, stormier future, we risk locking in repeated failure.
When a pattern is this clear, the question becomes unavoidable: What do we choose to do differently because of it?
For my colleagues and me, resilience cannot simply mean putting the grid back together after every storm the way it was before. It must mean investing first in the places that have experienced the longest outages and the slowest recoveries. It has to mean planning with vulnerability at the center, not as an afterthought. And it has to mean listening to community leadership, where the people closest to the harm help shape the solutions from the very beginning.
The grid may be invisible on a normal day, but in the dark, its design—and its inequities—become impossible to miss. Extreme weather is no longer an edge case. It is the context. When outages disproportionately affect the same communities again and again, resilience ceases to be a technical challenge and becomes a question of responsibility.
This decade of data doesn’t just confirm what communities have long known and bemoaned. It points directly to where the work must start.