

Well, it’s official: we’re already observing the strongest El Niño on record. The ocean surface temperature in the Niño 3.4 region, an ocean area in the eastern Tropical Pacific where we track El Niño, reached a record high anomaly compared with its 30-year average. In other words, this region has never been warmer.
On top of this record-breaking news, California declared a state of emergency in anticipation of the upcoming El Niño. The declaration directs state agencies “to begin protecting vulnerable communities, prepare roads and critical infrastructure, stage emergency supplies, and help local partners reduce flood, landslide, and coastal risks.”
This Super El Niño will no doubt significantly impact the Southwestern US this winter, with effects from record-high sea levels and coastal erosion to the potential for excessive rainfall and consequent flash flooding throughout the southern half of the country.
And remember, what happens in the ocean doesn’t stay in the ocean: we’re seeing this El Niño impact weather patterns around the world, modifying where precipitation—and lack thereof—occurs, as I’ll discuss below.
Record-breaking El Niño according to ONI
We’re now observing a record El Niño, according to the Oceanic Niño Index (ONI), which measures ocean surface temperature anomaly (with respect to the 30-year average) in the Niño 3.4 region. This record is particularly striking because it’s only September— El Niño doesn’t typically peak until November-January. It would be one thing to observe a record ONI value in December; the fact that it’s happening in September is indicative of an upcoming El Niño that is truly off the historical charts.
But there is a nuance worth mentioning: while ONI does technically remove the effects of background ocean warming from fossil fuel-driven climate change, it does so in a way that can mis-define an El Niño event. ONI is literally the 30-year average ocean temperature (“climatology”) in the Niño 3.4 region subtracted from the values observed today.
However, this climatology is continuously changing due to fossil fuel-driven climate change, so the definition of an El Niño will change based on the climatology used. For example, something that may have been considered an El Niño in the 1950s may not be considered an El Niño in today’s climate merely because of the gradual warming of the oceans due to climate change.
NOAA scientists realized this problem over the last few years as the oceans continued to warm and the climatology increased. In 2024, they introduced the Relative Oceanic Niño Index (RONI). The RONI gives a more accurate picture of the strength of the developing El Niño: it removes the effects of a changing climatology, allowing for El Niños from different decades to be compared more directly. RONI became NOAA-official earlier this year.
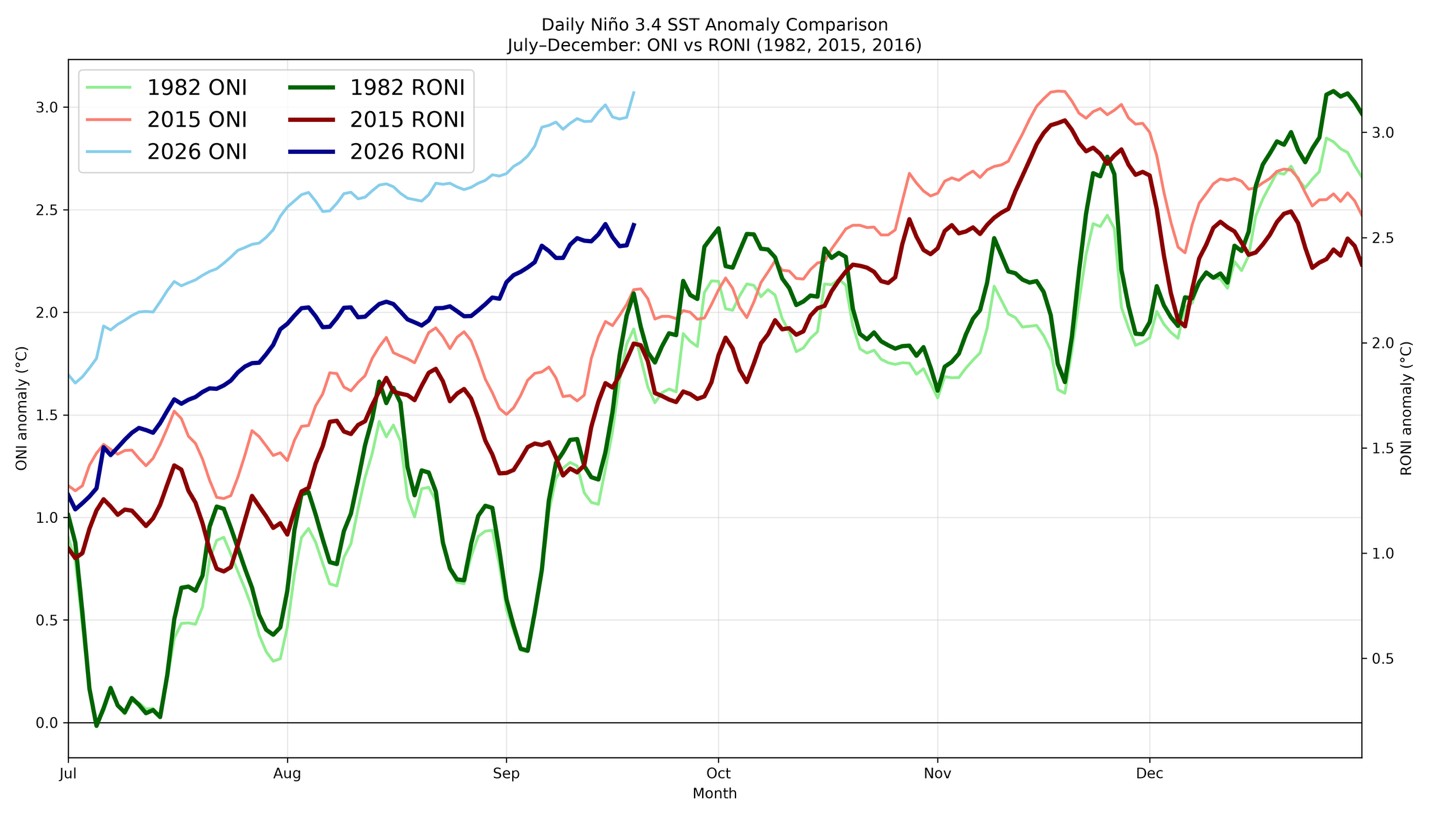
Believe it or not, according to the RONI, we’re still near record-breaking territory, meaning that even considering the different climatologies influenced by fossil fuel-driven climate change, we are still seeing a near-unprecedented El Niño (though 2015 and 1982 RONI values still remain more intense).
In other words, putting the different El Niños (1982, 2015, and 2026) on the same playing field by removing any background influence of climate change or climatological bias, puts the 2026 El Niño as the third strongest for any time of year in recorded history. It’s also the strongest El Niño for where we are now in early October, which is no doubt manifesting in the lack of hurricane season in the Atlantic, and the record hurricane season in the East Pacific.
A reason for this is that, as I mentioned in my April blog on the developing Super El Niño, there is evidence that, while El Niño is part of a natural cycle in our climate system, climate change produces more intense El Niño events. We also see this in a paleoclimate study looking at El Niños from thousands of years ago.
How El Niño impacts global weather patterns
There’s a lot of talk of record-breaking El Niño, but why does this matter for you? This is what I mean by “what happens in the ocean doesn’t stay in the ocean,” and why it’s particularly true in the Tropical Pacific right now.
Believe it or not, the location of storms and precipitation in the Pacific actually follows the warmest ocean surface temperatures. When the area of warmest ocean surface temperatures moves, so too does the main development region of storms and precipitation.
Storms in the Tropical Pacific are powerful beasts: they send up an incredible amount of energy from around the equator to the midlatitudes—the area of the Earth between the equator and the North or South Pole—which directly impacts where weather sets up here in the US.
Check out these two schematics below. In the first figure, the red “1.” indicates warm ocean surface temperatures over surrounding Indonesia and Oceania, which is a typical setup. In response to this warmth, storms and precipitation develop right over Indonesia and surrounding countries (denoted by clouds). These storms then send a wave of energy (the yellow “2.”) to the midlatitudes (in this case, I’m just showing the northern midlatitudes). The energy then affects the position of the jet stream, basically a river of fast-moving air in the upper atmosphere, that guides our weather systems.
A schematic showing the typical setup of warm ocean temperatures and precipitation in the Pacific Ocean. Created in PowerPoint.
A schematic showing the changes associated with an El Niño in the Pacific Ocean. Created in PowerPoint.
The second figure shows what an El Niño does: it shifts the area of warm ocean surface temperatures to the Central or Eastern Pacific (“1.”). This then shifts the area of storms and precipitation, and therefore the energy being communicated to the midlatitudes (“2.”). The jet stream also shifts (“3.”), allowing for more moisture to be transported inland and more rainfall to be observed in southern parts of the US.
And the shifts shown in the second schematic don’t just stay in the Pacific and the US. They’re communicated around the world. We often see drought in Indonesia, Caribbean, southern Brazil, Mozambique, and Botswana; a delayed monsoon in India and Southeast Asia; and increased precipitation in Uruguay and Argentina.
Regional weather impacts this winter
So, since El Niño can impact global weather patterns through a shift in how energy is sent to the midlatitudes from the tropics, what does this mean for the US? As is hinted in the schematic, the forecast for California and the Southwest US reflects this shift in precipitation patterns: the current seasonal forecast for California and the rest of the Southwest is above average precipitation expected this winter.
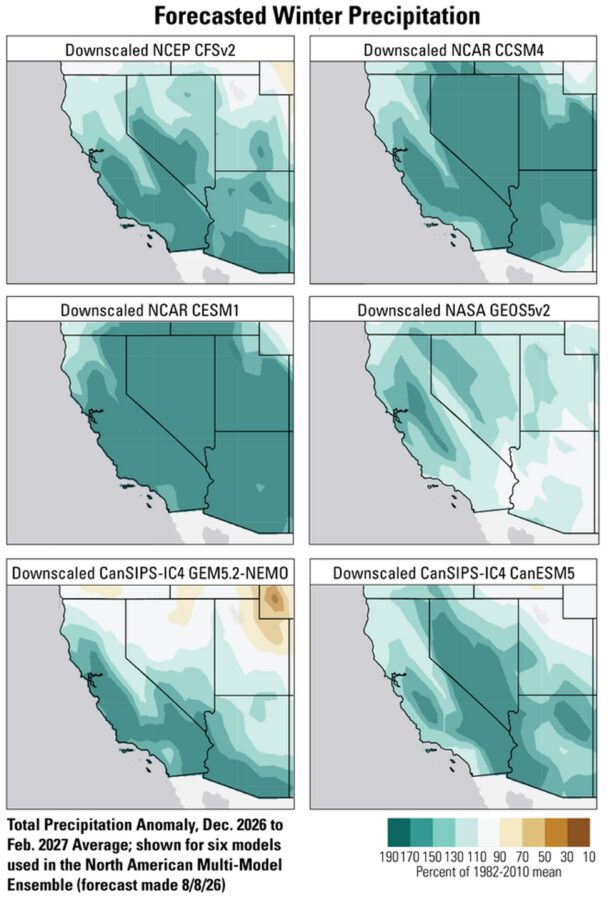
However, just because there’s an El Niño doesn’t mean we’ll observe more precipitation than usual in California. For example, during the last Super El Niño in 2015-2016, California saw a slightly drier-than-usual winter. Yes, El Niño shifts weather patterns, but it doesn’t always do it in anticipated or predictable ways.
For this year, seasonal weather model forecasts are generally in agreement and calling for a rainy winter, which could bring some significant drought relief to the Southwest. There is, however, a point where too much rain can fall. As the California State of Emergency notes, there is a significant threat for floods and landslides similar to those experienced during the Super El Niño of 1998.
And then there’s the threat of sea level rise. Sea levels have already risen off the California coast about 8 inches in some areas due to fossil fuel-driven climate change due to heat expansion. During an El Niño, a giant “wave” of water, called a “Kelvin wave,” typically raises sea levels in California. In fact, sea levels could rise by a foot in the next few days.
On top of the thermal expansion from climate change and the Kelvin wave, tides are expected to peak around Thanksgiving and Christmas. Throw a few storm systems on top of that, and you get significant sea level rise in California. The Kelvin wave alone could add another 6 inches of coastal sea level rise.
Across the world, a threat to human food systems
Earlier in August, the World Food Programme released an analysis highlighting how this El Niño will affect global food systems. Tens of millions of additional people could face food insecurity over the next year as regions deal with drought, including Central America, the Caribbean, and eastern and southern African countries. El Niño is also expected to significantly impact global food prices over the next year.
Furthermore, this Super El Niño will release a significant amount of heat from the oceans into the atmosphere, allowing for global heat temperature records to be shattered over the next year. In fact, a new study from University of Chicago’s Climate Impact Lab suggests there could be over 451,000 excess deaths this year due to heat.
The reality of the world we live in
As a climate scientist, I find it harder and harder to share this reality and close on a high note or, frankly, even on a call to action. This Super El Niño is a global force of nature, wildly exacerbated by human-caused climate change, and nothing we do today is going to contain it. But we can prepare far better than we are preparing today.
That includes making sure FEMA and NOAA are fully funded for emergency preparation/response and weather and climate forecasting, respectively. As always, it’s important to hold the bad actors accountable who have been spreading misinformation around climate change for decades —the fossil fuel industry. Check out my blog on three ways scientists can hold Big Oil accountable.